
Aggregates Producer Price Index Reveals Regional Trends.
By Denys Vasylenko, Julia Georgi and Barry Hudson
As we delve deeper into the intricate world of the Aggregates Producer Price Index (APPI), we shift our focus from individual states to a broader perspective, examining how various regions across the United States fared in the first half of 2023. The APPI, a valuable tool for evaluating pricing dynamics within the aggregates materials industry, offers us a lens through which we can decipher the evolving landscape.
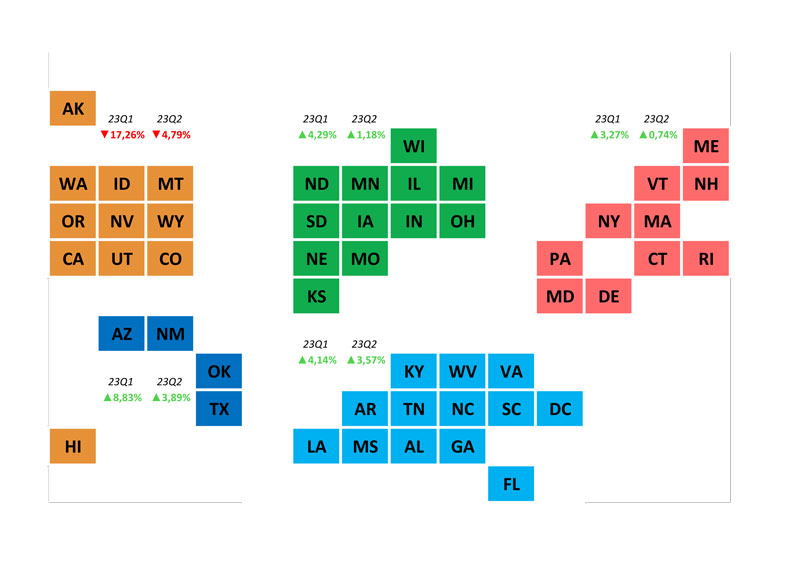
All Geologies
Southeast Region
The Southeast saw a 4.14% increase in first quarter 2023, driven partly by a boost in construction spending. In May 2023, construction spending in the United States surged by 0.9% month-over-month, signaling robust activity. This could have catalyzed the demand for aggregates in this region. However, the second quarter showed a moderate 3.57% increase, possibly due to the emergence of cost pressures linked to construction materials.
Midwest Region
The Midwest’s conservative 4.29% increase in the first quarter may reflect an awareness of the rising costs of construction and higher mortgage rates in February. Still, with total construction starts up 8% in May, the Midwest saw a 1.18% second quarter increase in APPI, indicating steady demand amid these challenges.
Southwest Region
The Southwest region experienced robust growth in the first quarter, with an 8.83% increase, mirroring the rise in new home sales in May. This surge in housing demand has driven the need for aggregates. the second quarter continued with a 3.89% increase, possibly as the region adjusted to higher construction costs.
Northeast Region
The Northeast maintained modest but consistent growth in the first quarter with a 3.27% increase. This could be attributed to a growth in construction spending in May 2023. However, with a flat position in the second quarter, this region might be cautiously adapting to rising materials prices.
West Region
The West faced an exceptional challenge with a 17.26% decrease in the first quarter, indicating potential disruptions in the housing market. Despite a recovery in the second quarter, with a 4.79% decrease, this region grapples with factors like limited inventory and increased construction costs.
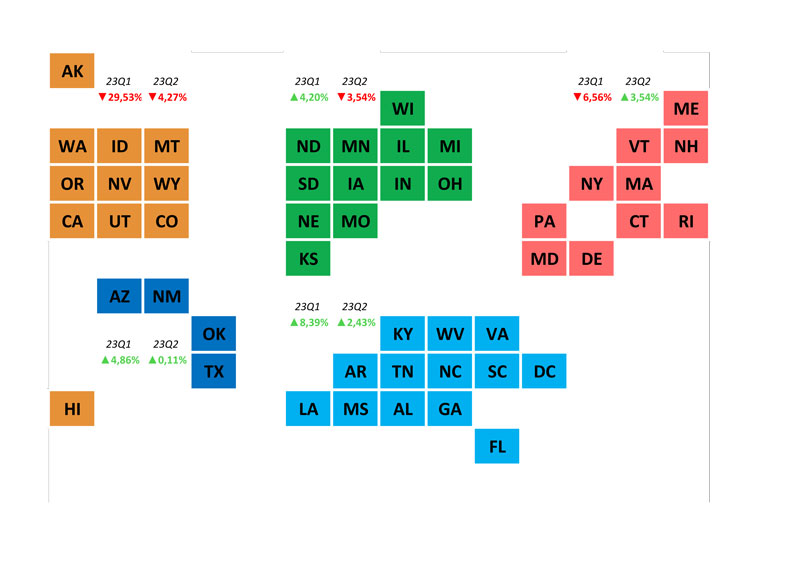
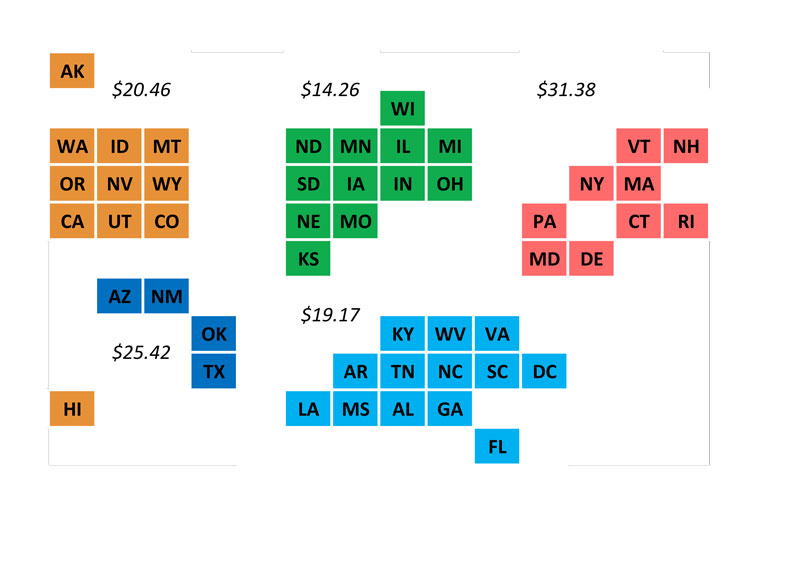
Concrete Sand
Southeast Region
A robust 8.39% increase in the first quarter, linked to growing construction spending, was followed by a 2.43% increase in the second quarter, possibly as the region responded to cost pressures and fluctuating demand. With an average price of $25.42 per ton, it significantly outpaces other regions.
Midwest Region
A 3.54% decrease in the second quarter hinted at the challenges posed by higher construction costs, despite a 4.20% increase in the first quarter. Midwest even offers concrete sand at an average price of $14.26 per ton, which is more than $10 a ton cheaper than the equivalent product in the Southeast region.
Southwest Region
Stability prevailed in the Southwest, with a flat situation in the second quarter following a 4.86% increase in the first quarter, potentially due to balanced demand and supply dynamics. With an average price of $19.17 per ton, the Southwest maintains a competitive edge for concrete sand.
Northeast Region
After a 6.56% decrease in the first quarter, the Northeast rebounded with a 3.24% increase in the second quarter, likely reflecting changing demand patterns in the construction sector. Northeast commands a higher-than-average price of $20.46 per ton for concrete sand.
West Region
The West’s substantial 29.53% decrease in the first quarter and 4.27% decrease in the second quarter could be related to challenges in the housing market and increased construction costs. West showcases the highest concrete sand prices at $31.38 per ton. This intriguing disconnect suggests other influential factors at play, possibly cost fluctuations or regional demand nuances.
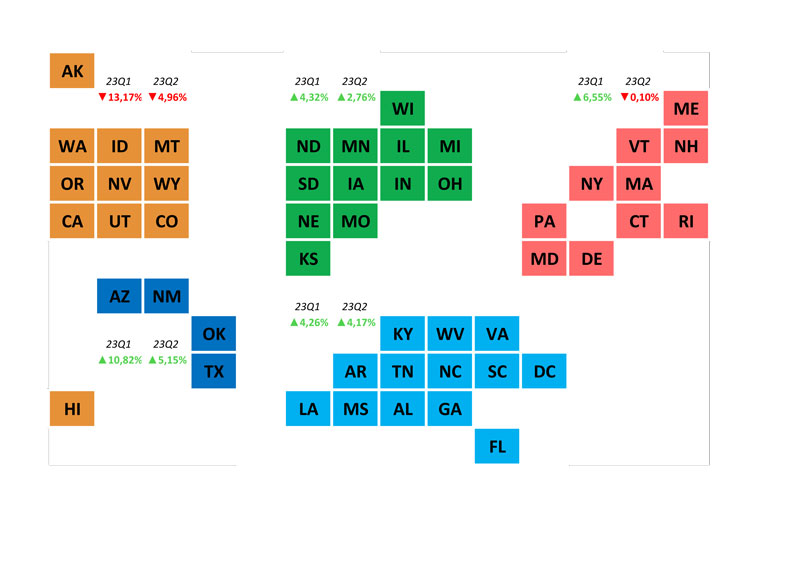
Coarse Aggregate
Southeast Region
Southeast commands the highest prices for #57 stone at $28.08 per ton, $28.64 per ton for #78 stone and leads in pricing for Type 1 base at $21.28 per ton. The steady demand for aggregates has propelled a 4.26% increase in the first quarter and a 4.17% increase in the second quarter in coarse aggregate prices.
Midwest Region
The Midwest’s 4.32% increase in the first quarter and 2.76% increase in the second quarter suggest resilience even during cost pressures. Midwest offers competitive pricing for #57 stone at $20.58 per ton and cost-effective #78 stone price at level of $21.00, although this is significantly lower than the Southeast region especially considering the main input costs of fuel, energy and labor are similar.
Southwest Region
Robust construction activities led to a 10.82% increase in the first quarter, followed by a 5.15% increase in the second quarter, indicating a strong market. Southwest holds mid position among all other regions with $12.56 per ton and offers #78 stone at a reasonable $16.40 per ton, suggesting a focus on affordability, but is a further step down in pricing compared to the Southeast.
Northeast Region
After a 6.55% increase in the first quarter, the Northeast showed stability with a flat 0.10% decrease in the second quarter, likely due to nuanced shifts in demand and maintains a competitive price of $21.21 per ton for #78 stone, maybe indicating a price rise cooling off period.
West Region
The West faced challenges with a 13.17% decrease in the first quarter and a -.96% decrease in the second quarter, possibly linked to market corrections and regional factors. With even such a decrease, the region offers a reasonable price of $19.31 per ton for #57 stone and a bit upper market pricing for other coarse materials indicating the recent boom time for pricing may well have passed in this region.
Getting Consistency and Optimal Prices
According to Cameron Garrett, director of sales and asphalt performance for Colas Inc, pricing of aggregates can be vastly different across the various regions and cities in which they operate. The factors that influence pricing policy are primarily local and can include cost inflation, supply/demand balance, trucking availability, ability to produce certain products, and market behaviors.
Figure 5. Average price of coarse aggregate across the regions for second quarter 2023.
The recent surge in inflation and supply chain impacts after Covid have made it necessary to rapidly adjust pricing in order to continue to serve our markets. Colas works with our local sales and management teams across the country to consider these and other local factors.
“We recognize that the overall demand for quality construction aggregates in the United States will grow over the next few decades along with the overall population and we want to remain in a position to serve our customers,” said Garrett.
Pricing of aggregates across the United States is quite inconsistent. This doesn’t come as a surprise, as the market is relatively unconsolidated, and of course the entire U.S. aggregates market is extremely large. There is no national player that is dominant, and many of the regions are dominated by larger privately held regional companies. Also, the concept of Price Management is something that is relatively fresh.
When Price-Bee.com performs a Price Diagnostic for a company, we also observe variation in pricing even down at product level. Depending on the degree of variation, this will show through when we consolidate the data.
There are also many ways of pricing in aggregates, and while Price-Bee has preferred methods, it doesn’t mean to say any other methodologies are incorrect. However, the key word in that last sentence is methodologies. Without a defined methodology or strategy/tactic, your pricing is likely to be erratic, even down at product level.
A solution to the issues and price disparity is to execute a Pricing Strategy. The most effective method of managing prices is with a piece of software called CPQ (Configure, Price Quote). Price-Bee.com performs these functions. With the advancement of cloud-based software you can manage your pricing, email a quote and when the quote is accepted, push that quote directly into your POS (Point of Sale) or dispatch system – such as JWS, Apex etc.
Pushing prices directly to your point of sales is a game changer. You can apply any type of price strategy you like, a tier strategy where you assign customers pricing on the volumes they purchase, a straight discount strategy, a cost-plus strategy, market segment strategy or a combination of any of these. If a geographic location that demands an alternate price for whatever reason. The adoption of smart quote/pricing processes will allow users to maximize their revenues.
So not only will you unleash your pricing potential, your back-office tasks around quote management and order fulfillment become more effective, faster and less prone to errors. Your customers will like it.
Denys Vasylenko, Julia Georgi and Barry Hudson are with Price-Bee.com