
A confluence of events around the housing market seems to portend that America’s shortfall in available homes will persist. Certainly, the higher interest rates of the past two years have made it harder to qualify for a mortgage, coupled with housing prices that just seem to continue to rise, even in the face of the headwinds of higher interest rates, rising materials costs, and labor shortages.
Couple those realities with another often-overlooked reality, which is that 3% home mortgage rates from the pandemic and pre-pandemic years are causing many who would like to move up, down, or opt to stay put, fearful they will never enjoy those rates again.
And They Are Right. The 3% mortgage is probably gone forever and won’t be seen again in our lifetimes. The reality of the higher rate environment is a downdraft on the new home market, despite signs of strength over the past few months, which highlights a harsh fact: America’s housing stock is aging rapidly, especially after the Great Recession, as total residential construction continues to fall behind in the number of new homes built when compared to demand.
A recent National Association of Homebuilders report drills down on these facts, and the numbers all point to housing stock that gets increasingly older each year. While new home construction added nearly 1.7 million units to the national stock from 2020 to 2022, this additional housing accounted for only 2% of owner-occupied housing stock in 2022.
Relatively newer owner-occupied homes built between 2010 and 2019 took up around 9%, while owner-occupied homes constructed between 2000 and 2009 make up 15% of the housing stock. The majority, or around 60%, of the owner-occupied homes were built before 1980, with around 35% built before 1970.
Due to a modest supply of new home construction relative to demand, and new household formations, the share of new construction built within the past 12 years declined greatly, from 17% in 2012 to only 11% in 2022. Meanwhile, the share of housing stock that is at least 53 years old experienced a significant increase over the 10-year period. The share in 2022 was 35% compared to 29% in 2012, meaning a third of all homes in America are more than half a century old.
Lack of Supply. With a lack of sufficient supply of new construction, the aging housing stock signals a growing remodeling market, as old structures need to add new amenities or repair or replace old systems and components. Rising home prices also encourage homeowners to spend more on home improvement. And we can’t forget that cheap, 30-year mortgage just adds pressure on owners of older houses to stay and improve their homes. Over the long run, the NAHB report implies that aging of the housing stock may cause remodeling to grow faster than new construction.
Another interesting fact in the report identifies another noteworthy trend: the median age of owner-occupied homes is 40 years old, up from 31 years of age in 2005, a steady climb that confirms the American dream of homeownership is taking longer to achieve.
There is no easy fix for the aging housing stock. The answer lies in a whole host of challenging fixes like less stringent zoning, managing the NIMBY factor, and the ever-present issue of affordability of newer homes. And the overall shortages are stunning; the Realtor organization reported last year that the gap between single-family home construction and household formations grew to 6.5 million homes between 2012 and 2022.
However, this figure overstates the housing shortage, since new multi-family homes offer options both to buyers and renters. If multi-family construction is included, which is predominantly rental units, this gap is cut to 2.3 million homes.
Some say only an intervention by the federal government will solve this, as it has done in part with FHA and VA loans. An out-of-the-box solution is needed to incentivize affordable new homes, or the trend in the further aging of our nation’s housing stock will just continue as it has for decades.
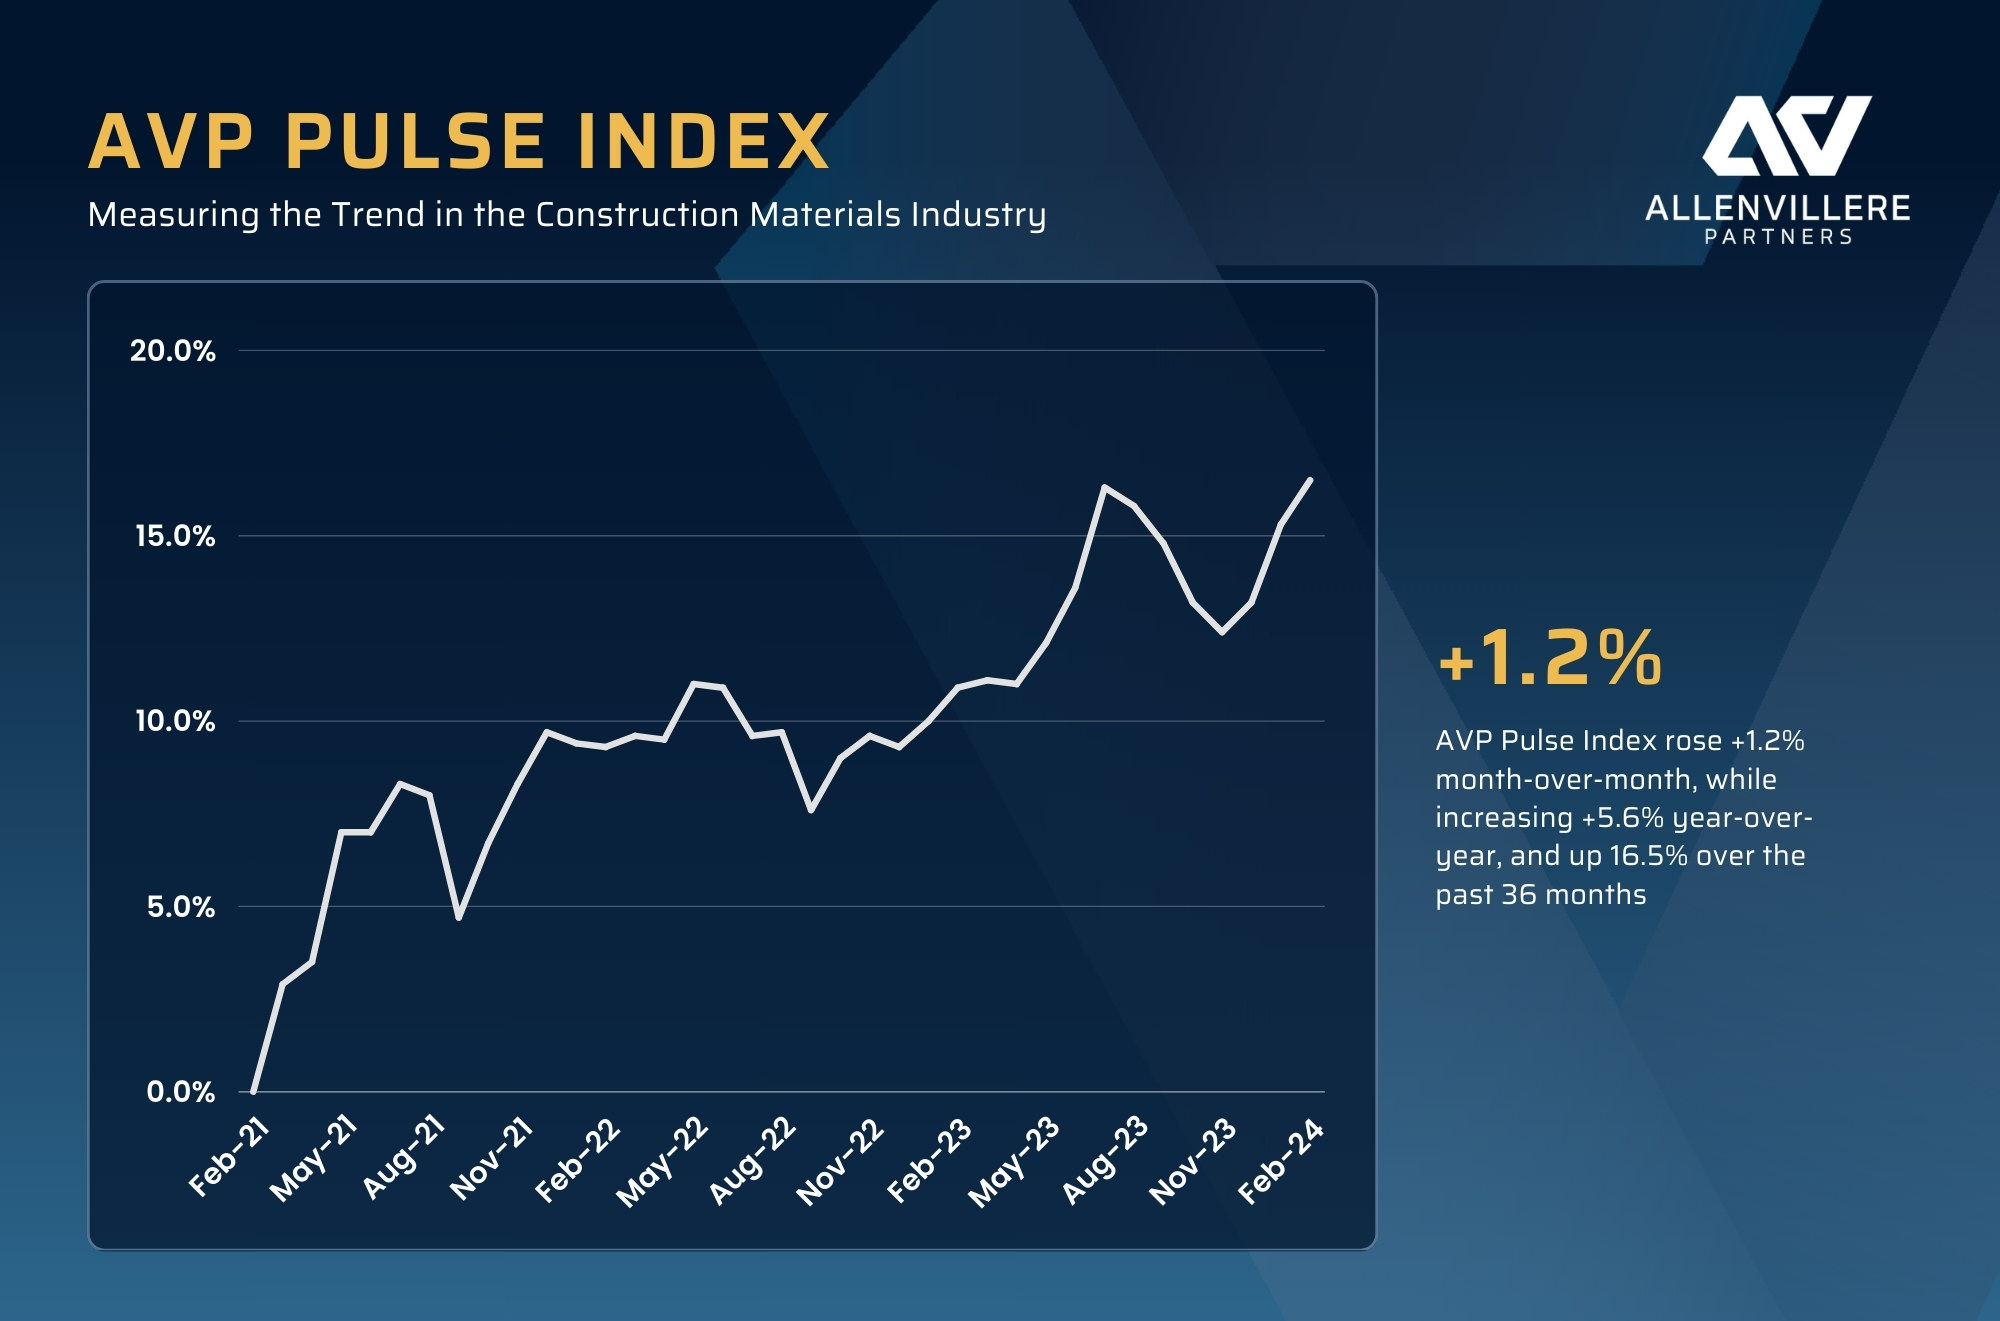
AVP Index. The monthly index was up 1.2% for the month, 5.6% for the Trailing 12 Months (TTM), and 16.5% over the last 36 months. Contributing to this continued forward momentum was the very strong NAHB/Wells Fargo Housing Market Index, which was up 7.0% for the month and adding dramatically to the TTM with a 9.0% gain. In addition, the industry stocks continue their march forward after taking a pause for some profit taking and are all making 52-week highs once again, realizing a 9.9% gain for the month, and 42.3% for the TTM. These two metrics bolstered the steady-to-slightly-ahead metrics of all the other indices that make up the balance of the algorithm.

Pierre G. Villere serves as president and senior managing partner of Allen-Villere Partners, an investment banking firm with a national practice in the construction materials industry that specializes in mergers and acquisitions. He has a career spanning almost five decades, and volunteers his time to educate the industry as a regular columnist in publications and through presentations at numerous industry events. Contact Pierre via email at [email protected]. Follow him on Twitter @allenvillere.