
Aggregates Industry Looks To Make Gains As Projects Move Forward.
By Mark S. Kuhar and Josephine Patterson
Since President Joe Biden signed the Infrastructure Investment and Jobs Act (IIJA) into law Nov. 15, 2021, states have committed federal funds to support more than 56,000 eligible transportation improvements in all 50 states during the last two years, spanning nearly every U.S. county, according to a review of the latest available federal data conducted by the American Road & Transportation Builders Association (ARTBA).
To mark the anniversary, ARTBA released the following data points to help highlight the scope and impacts of the law across the country:
- Nearly $100 billion in new project commitments.
- 168 projects receiving over $100 million in federal support.
- 96% of counties have at least one project.
- State Departments of Transportation (DOT) are increasing capital spending by 13%.
- Nearly $8 billion in road and bridge-related discretionary grant improvements announced by U.S. DOT.
- The value of state and local highway and bridge contracts awards was up a record-level 26% in 2022.
- In 2023, the value of awards is up in 35 states compared to 2022, increasing a total of 12%.
- Average highway construction employment in 2023 is up 8%.
- 24% of funds spent on new construction or added capacity.
Aggregates Production
Despite the enormous influx of new projects, aggregates production looks like it is in for a down year in 2023.
An estimated 712 million metric tons (Mt) of total construction aggregates was sold or used in the United States in the third quarter of 2023, a decrease of 3% compared with that in the third quarter of 2022, according to Jason Christopher Willett, commodity specialist, National Minerals Information Center, U.S. Geological Survey (USGS).
This marks the fourth straight quarterly decrease for aggregates production.
The estimated production for consumption in the first nine months of 2023 was 1.86 billion metric tons (Gt), a slight decrease compared with that in the same period of 2022.
The estimated production for consumption of construction aggregates in the third quarter of 2023 decreased in seven of the nine geographic divisions compared with that sold or used in the third quarter of 2022.
The five leading states were, in descending order of production for consumption, Texas, California, Michigan, Ohio and Florida. Their combined total production for consumption was 212 Mt, unchanged compared with that in the same period of 2022.
An estimated 437 Mt of crushed stone was sold or used in the United States in the third quarter of 2023, a decrease of 3% compared with that in the third quarter of 2022. The estimated production for consumption in the first nine months of 2023 was 1.17 Gt, essentially unchanged compared with that in the same period of 2022.
The estimated U.S. output of construction sand and gravel sold or used in the third quarter of 2023 was 275 Mt, a decrease of 4% compared with that in the third quarter of 2022. The estimated production for consumption in the first nine months of 2023 was 698 Mt, a decrease of 5% compared with that in the same period of 2022.
The five leading states combined total production for consumption in the first nine months of 2023 was 552 Mt, a decrease of 4% compared with that in the same period of 2022 and represented 30% of the U.S. total.
The above estimates are based on information reported to the U.S. Geological Survey (USGS) on its quarterly sample survey by construction aggregates producers.
Portland (including blended) cement consumption decreased 3% in the third quarter of 2023 compared with that of the third quarter of 2022. Consumption in the first nine months of 2023 also decreased slightly compared with that in the same period of 2022. This information was obtained from the USGS monthly survey of U.S. cement producers.
The estimated production for consumption of crushed stone in the third quarter of 2023 decreased in eight of the nine geographic divisions compared with that sold or used in the third quarter of 2022.
The five leading states were, in descending order of production for consumption, Texas, Missouri, Pennsylvania, Florida and Ohio. Their combined total production for consumption was 146 Mt, a decrease of 7% compared with that in the same period of 2022.
The estimated production for consumption of construction sand and gravel in the third quarter of 2023 decreased in seven of the nine geographic divisions compared with that sold or used in the third quarter of 2022.
The five leading states were, in descending order of production for consumption, California, Texas, Minnesota, Michigan and Arizona. Their combined total production for consumption was 106 Mt, essentially unchanged compared with that in the same period of 2022.
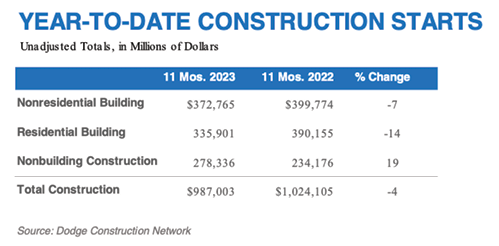
Construction Starts
Total construction starts fell 15% in November, dropping to a seasonally adjusted annual rate of $927 billion, according to Dodge Construction Network. Nonresidential building starts fell 29% during the month, residential starts lost 6%, and nonbuilding starts dropped 2%.
Highway and bridge starts were down 8%.
Year-to-date through November 2023, total construction starts lagged by 4% compared to the previous year. Residential and nonresidential starts were down 14% and 7%, respectively, but nonbuilding starts were up 19%.
“Construction starts are deeply feeling the impact of higher rates,” said Richard Branch, chief economist for Dodge Construction Network. “While the Federal Reserve seems poised to start cutting rates in the New Year, the impact on starts will lag. As a result, starts are expected to be weak through the mid-point of 2024 before growth resumes.”
Nonbuilding construction starts in November fell 2%, amounting to a seasonally adjusted $223 billion. As stated, highway and bridge starts decreased 8%, environmental public works starts fell 4%, utility/gas starts rose 17%, and miscellaneous nonbuilding starts improved by 1%.
Year-to-date through November, nonbuilding starts were up 19% overall. Utility/gas plants rose 49%, and miscellaneous nonbuilding starts increased 18%. Highway and bridge starts gained 9%, and environmental public works rose 11%.
The largest nonbuilding projects to break ground in November were the $834 million I-405 Brickyard to SR 527 improvements in Bothell, Wash., the $406 million second phase of the Sherco Solar Farm in Becker, N.M., and a $353 million addition to the Silverhawk Generating Station in Moapa, Nev.
Nonresidential building starts decreased 29% in November to a seasonally adjusted annual rate of $345 billion. Manufacturing starts plummeted 74% following a strong several strong project starts in October. Commercial starts fell 19% with office buildings being the only category to see a gain. Institutional starts rose 7% due to a significant uptick in healthcare activity. Year-to-date through November, total nonresidential starts were 7% lower than in 2022. Institutional starts gained 5%, while commercial and manufacturing starts fell 13% and 18%, respectively.
The largest nonresidential building projects to break ground in November were the $1.9 billion Children’s Hospital of Philadelphia Inpatient Tower in Philadelphia, the $1.6 billion LG Energy Battery Plant in Queen Creek, Ariz., and the $750 million expansion of the Iowa Army Ammunition Plant in Middletown, Iowa.
Residential building starts declined 6% in November to a seasonally adjusted annual rate of $359 billion. Single-family starts increased 1%, while multifamily starts fell 19%. Year-to-date through November 2023, total residential starts were down by 14%, with single-family starts dropping 15% and multifamily starts by 12%.
The largest multifamily structures to break ground in November were the $200 million 55 Broad Street residential conversion in New York City, the $200 million redevelopment of The Superman Building in Providence, R.I., and the $185 million Union West mixed-use development in Raleigh, N.C.
Housing Starts
Single-family construction surged in November as lower mortgage rates helped to assuage affordability concerns and unleash pent-up demand for housing.
Overall housing starts increased 14.8% in November to a seasonally adjusted annual rate of 1.56 million units, according to a report from the U.S. Department of Housing and Urban Development and the U.S. Census Bureau.
It takes 400 tons of aggregates to construct the average modern home, according to the National Stone, Sand & Gravel Association.
The November reading of 1.56 million starts is the number of housing units builders would begin if development kept this pace for the next 12 months. Within this overall number, single-family starts increased 18% to a 1.14 million seasonally adjusted annual rate. However, single-family starts are down 7.2% year-to-date. The multifamily sector, which includes apartment buildings and condos, increased 6.9% to an annualized 417,000 pace.
“Lower interest rates and a lack of resale inventory helped to provide a strong boost for new home construction in November,” said Alicia Huey, chairman of the National Association of Home Builders (NAHB) and a custom home builder and developer from Birmingham, Ala. “And while these higher starts numbers are consistent with our latest builder survey, which shows a rise in builder sentiment and future sales expectations, home builders continue to contend with elevated construction and regulatory costs.”
“The single-family starts figure is remarkably strong, and we would not be surprised to see this figure revised lower or fall back slightly in the next month, given the nearly 20% rise in November,” said NAHB Chief Economist Robert Dietz. “NAHB is forecasting an approximate 4% gain for single-family starts in 2024, as mortgage rates settle lower, economic growth slows and inflation moves lower.”
On a regional and year-to-date basis, combined single-family and multifamily starts are 16.7% lower in the Northeast, 12.3% lower in the Midwest, 6.2% lower in the South and 14.3% lower in the West.
Overall permits decreased 2.5% to a 1.46-million-unit annualized rate in November. Single-family permits increased 0.7% to a 976,000-unit rate. However, single-family permits are down 8.4% year-to-date. Multifamily permits decreased 8.5% to an annualized 484,000 pace.
Looking at regional permit data on a year-to-date basis, permits are 19.9% lower in the Northeast, 15.3% lower in the Midwest, 10.3% lower in the South and 12.8% lower in the West.
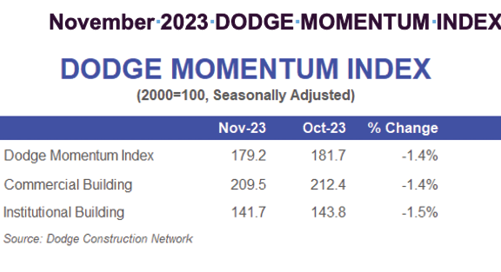
Dodge Momentum
The Dodge Momentum Index (DMI), issued by Dodge Construction Network (DCN), decreased 1% in November to 179.2 (2000=100) from the revised October reading of 181.7. Over the month, the commercial and institutional components both fell 1%.
“While both portions of the Momentum Index saw slower momentum in planning, overall levels remain steady and will support construction spending in 2024 and 2025,” stated Sarah Martin, associate director of forecasting for DCN. “Nonresidential planning activity will remain constrained from stronger growth amidst ongoing labor and construction cost challenges.”
Excluding data center activity, all commercial segments saw declines in November. On the institutional side, more momentum in healthcare and public projects was offset by continued weakness in education planning. Year over year, the DMI was 14% lower than in November 2022. The commercial segment was down 20% from year-ago levels, while the institutional segment was up 2% over the same time period.
A total of 17 projects valued at $100 million or more entered planning in November. The largest commercial projects include the $480 million Project Cosmo Data Center in Cheyenne, Wyo., and the $300 million Sherwin Williams “HQ2” Headquarters Building in Cleveland.
The largest institutional projects include the $315 million phase two of the FSU Health Hospital in Tallahassee, Fla., and the $258 million LA Convention Center Exhibition Hall in Los Angeles.
The DMI is a monthly measure of the value of nonresidential building projects going into planning, shown to lead construction spending for nonresidential buildings by a full year.
Construction Materials Prices
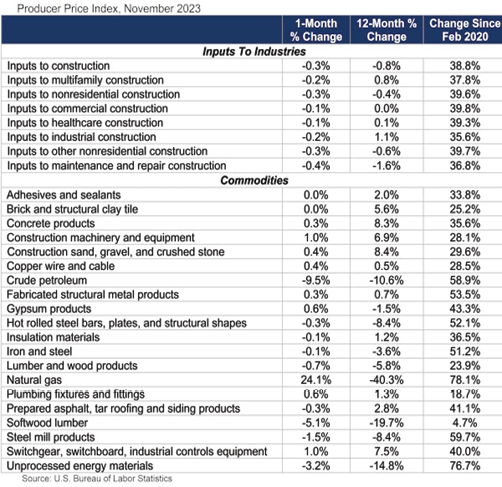
Construction input prices decreased 0.3% in November compared to the previous month, according to an Associated Builders and Contractors (ABC) analysis of the U.S. Bureau of Labor Statistics’ Producer Price Index data. Nonresidential construction input prices decreased 0.3% for the month as well. Inputs to construction are still nearly 39% higher than at the start of the COVID-19 pandemic. Construction sand, gravel and crushed stone prices rose 0.4% for the month; 8.4% year over year; and have risen 29.6% since February 2020.
Overall construction input prices are 0.8% lower than a year ago, while nonresidential construction input prices are 0.4% lower. Prices decreased in two of the three energy subcategories in November. Crude petroleum input prices were down 9.5%, while unprocessed energy materials prices were down 3.2%. Natural gas prices rose 24.1% in November.
“Construction input prices declined for the second straight month in November,” said ABC Chief Economist Anirban Basu. “While much of the recent decline is due to record domestic oil production and the resulting precipitous decline in gas and diesel prices, other commodities like iron and steel and lumber products are currently more affordable than they were at the same time last year.
“Falling, or at the very least stable, input prices should help to control construction cost increases in the coming quarters,” said Basu. “This is a welcome development for an industry still dealing with extraordinarily elevated financing costs and rising labor costs due to ongoing worker shortages.”

Great Lakes Limestone
Shipments of limestone on the Great Lakes totaled 3.1 million tons in November, an increase of 22.8% compared to a year ago, according to the Lake Carriers’ Association. Limestone cargos were 7.3% above the month’s five-year average.
Loadings from U.S. quarries increased 23.6% to 2.6 million tons. Shipments from Canadian quarries totaled 536,912 tons, an increase of 19.2%.
Year-to-date the limestone trade stands at nearly 26.6 million tons, a decrease of 3.3% compared to a year ago. Loadings from Michigan and Ohio quarries decreased by 2.2% to nearly 21.5 million tons, while shipments from Ontario quarries totaled 5.2 million tons, a decrease of 7.5% from 2022.
Since 1880, Lake Carriers’ has represented the U.S.-flag Great Lakes fleet, which today can move more than 90 million tons of cargos annually that are the foundation of American industry, infrastructure, and power.
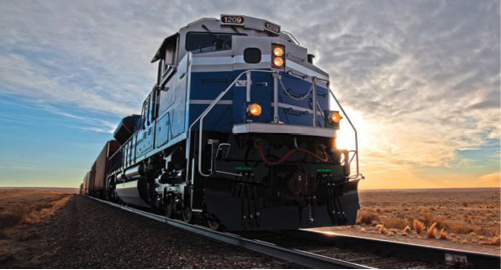
Aggregates Rail Traffic
The Association of American Railroads (AAR) reported U.S. rail traffic volumes for November 2023.
U.S. railroads originated 1,128,573 carloads in November 2023, down 0.0%, or 102 carloads, from November 2022. U.S. railroads also originated 1,279,906 containers and trailers in November 2023, up 5.0%, or 60,486 units, from the same month last year. Combined U.S. carload and intermodal originations in November 2023 were 2,408,479, up 2.6%, or 60,384 carloads and intermodal units from November 2022.
In November 2023, 12 of the 20 carload commodity categories tracked by the AAR each month saw carload gains compared with November 2022. These included: chemicals, up 8,322 carloads or 5.7%; motor vehicles & parts, up 4,611 carloads or 6.6%; and petroleum and petroleum products, up 4,510 carloads or 10.1%.
Commodities that saw declines in November 2023 from November 2022 included: crushed stone, sand and gravel, down 8,052 carloads or 8.0%; all other carloads, down 6,851 carloads or 25.6%; and grain, down 6,290 carloads or 5.4%.
“U.S. intermodal volume rose 5.0% in November, its third straight year-over-year gain after 18 straight declines and the biggest year-over-year percentage gain for intermodal in 29 months. Overall, the last week of November had the highest carload plus intermodal volumes in two years,” said AAR Senior Vice President John T. Gray. ” Much will depend on how the broader economy continues to evolve, but railroads are hopeful November will provide much-needed momentum for the rest of 2023 and into 2024.”
Excluding coal, carloads were down 1,059 carloads, or 0.1%, in November 2023 from November 2022. Excluding coal and grain, carloads were up 5,231 carloads, or 0.8%.
Total U.S. carload traffic for the first 11 months of 2023 was 10,824,994 carloads, up 0.2%, or 21,700 carloads, from the same period last year; and 11,684,971 intermodal units, down 6.0%, or 748,046 containers and trailers, from last year.
Total combined U.S. traffic for the first 48 weeks of 2023 was 22,509,965 carloads and intermodal units, a decrease of 3.1% compared to last year.