
The U.S. Geological Survey (USGS) just released its Mineral Commodity Summaries 2024 publication, an annual information source that offers capsule summaries of specific mineral commodities in the United States, including crushed stone, and sand and gravel.
In its initial capsule summary, USGS notes that in 2023, the estimated total value of nonfuel mineral production in the United States was $105 billion, an increase of 4% from the revised total of $101 billion in 2022.
The total value of industrial minerals production was $69.9 billion, a 7% increase from a revised total of $65.3 billion in 2022. Of the total value of industrials minerals production, $35.2 billion was construction aggregates production (construction sand and gravel and crushed stone). Crushed stone was the leading nonfuel mineral commodity in 2023 with a production value of $24 billion and accounted for 23% of the total value of U.S. nonfuel mineral production.
Crushed Stone
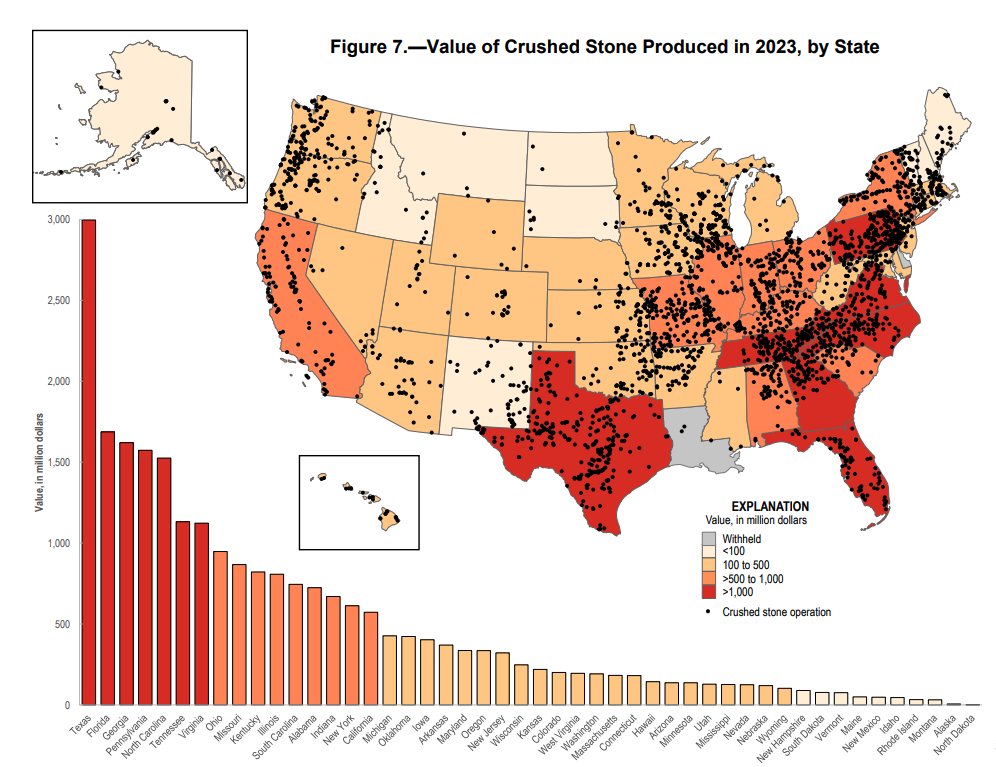
In 2023, 1.5 billion tons of crushed stone valued at more than $24 billion was produced by an estimated 1,400 companies operating 3,500 quarries and over 180 sales and (or) distribution yards in 50 states. Leading states were, in descending order of production, Texas, Florida, Missouri, Pennsylvania, Ohio, Georgia, North Carolina, Kentucky, Illinois and Tennessee, which together accounted for about 54% of total crushed stone output.
Of the total domestic crushed stone produced in 2023, about 69% was limestone and dolomite; 15%, granite; 6%, traprock; 6%, miscellaneous stone; and 3%, sandstone and quartzite; the remaining 1% was divided, in descending order of tonnage, among marble, volcanic cinder and scoria, calcareous marl, shell and slate.
An estimated 70% of crushed stone was used as a construction aggregate, mostly for road construction and maintenance; 20% for cement manufacturing; 7% for lime manufacturing; 1% for agricultural uses; and the remaining 2% for other chemical, special, and miscellaneous uses and products.
The output of crushed stone in the United States shipped for consumption in the first nine months of 2023 was 1.17 billion tons, essentially unchanged compared with that in the same period in 2022. Third-quarter shipments for consumption decreased by 3% compared with those in the same period in 2022. Additional production information, by quarter, for each state, geographic division, and the United States is reported by the U.S. Geological Survey in its quarterly Mineral Industry Surveys for construction sand and gravel and crushed stone.
Consumption of crushed stone for residential construction decreased in 2023 because of decreases in residential housing demand caused by interest rates increasing to the highest levels in 20 years. Usually, commercial and heavy-industrial construction activity, infrastructure funding, labor availability, new single-family housing unit starts, and weather affect rates of crushed stone production and consumption.
Long-term increases in construction aggregates demand are influenced by activity in the public and private construction sectors, as well as by construction work related to infrastructure improvements around the Nation. The underlying factors that would support an increase in prices for crushed stone are expected to be present in 2024, especially in and near metropolitan areas.
The crushed stone industry continued address health and safety regulations, permitting and zoning issues, and environmental restrictions in 2023. The 2021 Infrastructure Investment and Jobs Act reauthorizes surface transportation programs for five years and invests billions in additional funding to repair roads and bridges, and support major transformational projects.
This included $118 billion to the Highway Trust Fund – $90 billion to the highway account and $28 billion to the transit account. Shortages in some urban and industrialized areas are expected to continue to increase owing to local zoning regulations and land-development alternatives. These issues are expected to continue and to cause new crushed stone quarries to be located away from large population centers. Resultant regional shortages of crushed stone and higher fuel costs could result in higher-than-average price increases in industrialized and urban areas.
Sand and Gravel
U.S. construction sand and gravel production was about 920 million tons in 2023, a decrease of 4% compared with that in 2022. Apparent consumption also decreased to 920 million tons.
Consumption of construction sand and gravel decreased in 2023 because of decreases in residential housing demand caused by interest rates increasing to the highest levels in 20 years. Usually, commercial and heavy-industrial construction activity, infrastructure funding, labor availability, new single-family housing unit starts, and weather affect growth in construction sand and gravel production and consumption.
Long-term increases in construction aggregates demand are influenced by activity in the public and private construction sectors, as well as by construction work related to infrastructure improvements around the nation. The underlying factors that would support an increase in prices for construction sand and gravel are expected to be present in 2024, especially in and near metropolitan areas.
The construction sand and gravel industry continued to address health and safety regulations, permitting and zoning issues, and environmental restrictions in 2023. Movement of sand and gravel operations away from densely populated regions was expected to continue where zoning regulations and local sentiment discouraged them. Resultant regional shortages of construction sand and gravel and higher fuel costs could result in higher-than-average price increases in industrialized and urban areas.
Industrial Sand and Gravel
In 2023, industrial sand and gravel production was an estimated 130 million tons valued at an estimated $7.0 billion. The quantity of industrial sand and gravel sold or used increased by 14%, and the value increased by 36% compared with that in 2022.
Industrial sand and gravel was produced by 106 companies from 199 operations in 33 states. The leading producing states were, in descending order of production, Texas, Wisconsin, Illinois, Louisiana, Oklahoma, Missouri, Arkansas, Michigan, California and Iowa. Combined production from these states accounted for about 89% of total domestic sales and use.
Approximately 81% of the U.S. tonnage was used as hydraulic-fracturing sand (frac sand) and well-packing and cementing sand, and 8% as glassmaking sand. Other common uses were, in decreasing quantity of use, foundry sand, whole grain fillers for building products, filtration sand, and recreational sand, which accounted for 7% combined. Other minor uses were, in decreasing quantity of use, chemicals, roofing granules, abrasives, silicon and ferrosilicon, ceramics, fillers, traction, filtration gravel, and metallurgic flux, which accounted for 2% combined. Other unspecified uses accounted for 2% combined
In 2023, industrial sand and gravel production was an estimated 130 million tons valued at an estimated $7.0 billion. The quantity of industrial sand and gravel sold or used increased by 14%, and the value increased by 36% compared with that in 2022.
U.S. apparent consumption of industrial sand and gravel was estimated to be 120 million tons in 2023, an 11% increase from that in 2022. The most important driving force in the industrial sand and gravel industry remained the production and sale of frac sand.
In recent years, the consumption of frac sand increased as hydrocarbon extraction from shale deposits increased and the quantity of frac sand used per well increased in the United States. In 2023, industrial sand and gravel consumption increased as demand for frac sand increased and also led to higher prices for frac sand. Increased apparent consumption for other end uses in 2023 resulted from continued economic recovery from the effects of the global coronavirus disease 2019 (COVID-19) pandemic.
Imports of industrial sand and gravel in 2023 were an estimated 290,000 tons, a 14% decrease from those in 2022. The United States remained a net exporter of industrial sand and gravel; U.S. exports of industrial sand and gravel were an estimated 7,500,000 tons, an 18% increase from those in 2022.
The United States was the world’s leading producer and consumer of industrial sand and gravel based on estimated world production figures. Collecting definitive data on industrial sand and gravel production for most nations is difficult because of the wide range of terminology and specifications used by different countries.
The United States remained a major exporter of industrial sand and gravel, shipping it to almost every region of the world. High global demand for U.S. industrial sand and gravel is attributed to its high quality and to the advanced processing techniques used in the United States for many grades of industrial sand and gravel, meeting specifications for virtually any use.