
Breaching The Gap Between Strategy And Execution.
By Julia Georgi and Denys Vasylenko
When experienced managers join the aggregates industry, they often get intrigued by how confidently the sales department speaks about markets they cover. Aggregate salespeople say they know what customers want in terms of products and services; they also know everything about upcoming bids, current market price levels and, of course, they understand their competitive position in each situation. Yet, they have little or no documented data to support most of this knowledge.
In contrast, top management will have thick market share reports and growth forecasts along with some key information about competition. However, anyone who tried to sell anything would understand that salespeople cannot rely on such non granular data and most importantly they probably did not create this data.
Such obvious disconnect between strategic thinkers and frontline actors does not mean that parties have no clue what’s going on. Quite the opposite.
Knowledge Gap Context and Lack of Actionable Data
Strategy managers and top executives very well understand the basics of success – stable demand, location and right product availability at the right price. They understand the value of timely investment into mineral resource deposits and advantages and disadvantages of vertical integration in any given market. And since the permitting process is getting longer and longer in most countries, a five- to 10-year vision does not seem to be too lengthy.
On the other side aggregate salespeople work side by side with clients focusing on securing planned sales volumes and fulfilling orders for the next three to 12 months. And they don’t need customer satisfaction surveys or market reports to help them do their daily jobs. Because when things go right or wrong they already know it.
Without disrespecting Peter Drucker, the common situation described above demonstrates that beliefs like “if you can’t measure you can’t manage” are not helpful in our industry.
Because aggregates people clearly know how to manage operations and sell stone with quite measurable results in their P&Ls (otherwise most quarries would just close). The question is more about are those profits levels adequate in each market and how they can be maximized to their full potential. Another curious aspect is how can we be sure in any market context assumption when we rely on the good will of a salesperson that is, like most of us, just a human with an opinion.
Pragmatic & Useful MB Reports With Some Description and Illustrations
In the dynamic and highly competitive Aggregates industry, relying solely on salespersons’ experience without quantitative assessment can often lead to an incomplete understanding of market trends and potential. To bridge this gap, top management requires comprehensive market reports that provide a holistic view of the industry landscape. Through the effective utilization of a Market Bee managers can gain valuable insights and make data-driven decisions.
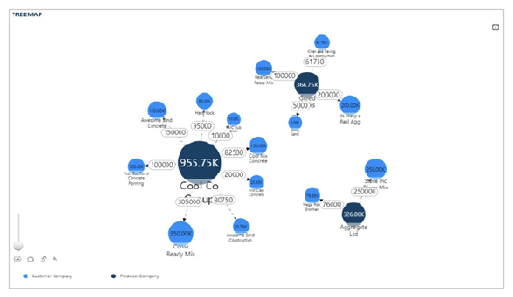
Network Graph: Visualizing Manufacturer-Buyer Dynamics
The network graph acts as a visual representation of the intricate connections between manufacturers and buyers, segmented by product categories. This plot showcases the amount of volume sold by each producer and indicates the capacity of customers to accept these.
For instance, if a producer has been consistently reaching out to a specific customer but with limited success, this could be highlighted through low sales and acceptance figures. Furthermore, segment-based splitting allows for a deeper understanding of where the volume are most in demand, helping tailor strategies accordingly.
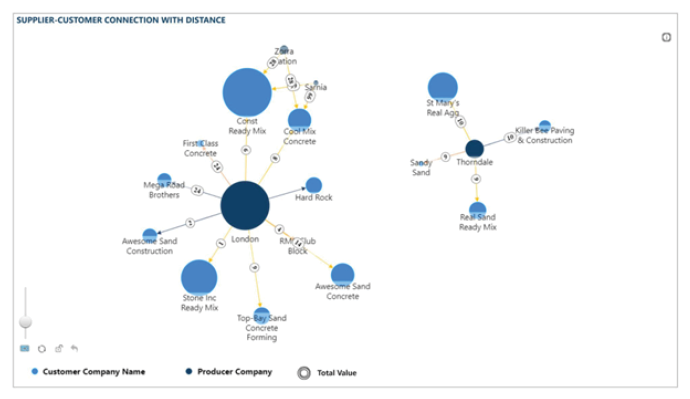
Supplier-Customer Connection Graph: Navigating the “Last Mile”
The supplier-customer connection graph focuses on distances between producers and customers in terms of segments. This graph essentially aids in addressing the industry’s “last mile” challenge, where the gap between sides’ requirements can hinder sales.
By highlighting the segments in which these distances are relatively high, salespersons and managers can direct their efforts towards bridging these gaps. For example, if a particular segment shows significant customer demand but minimal sales, it signifies an untapped potential that could be exploited.
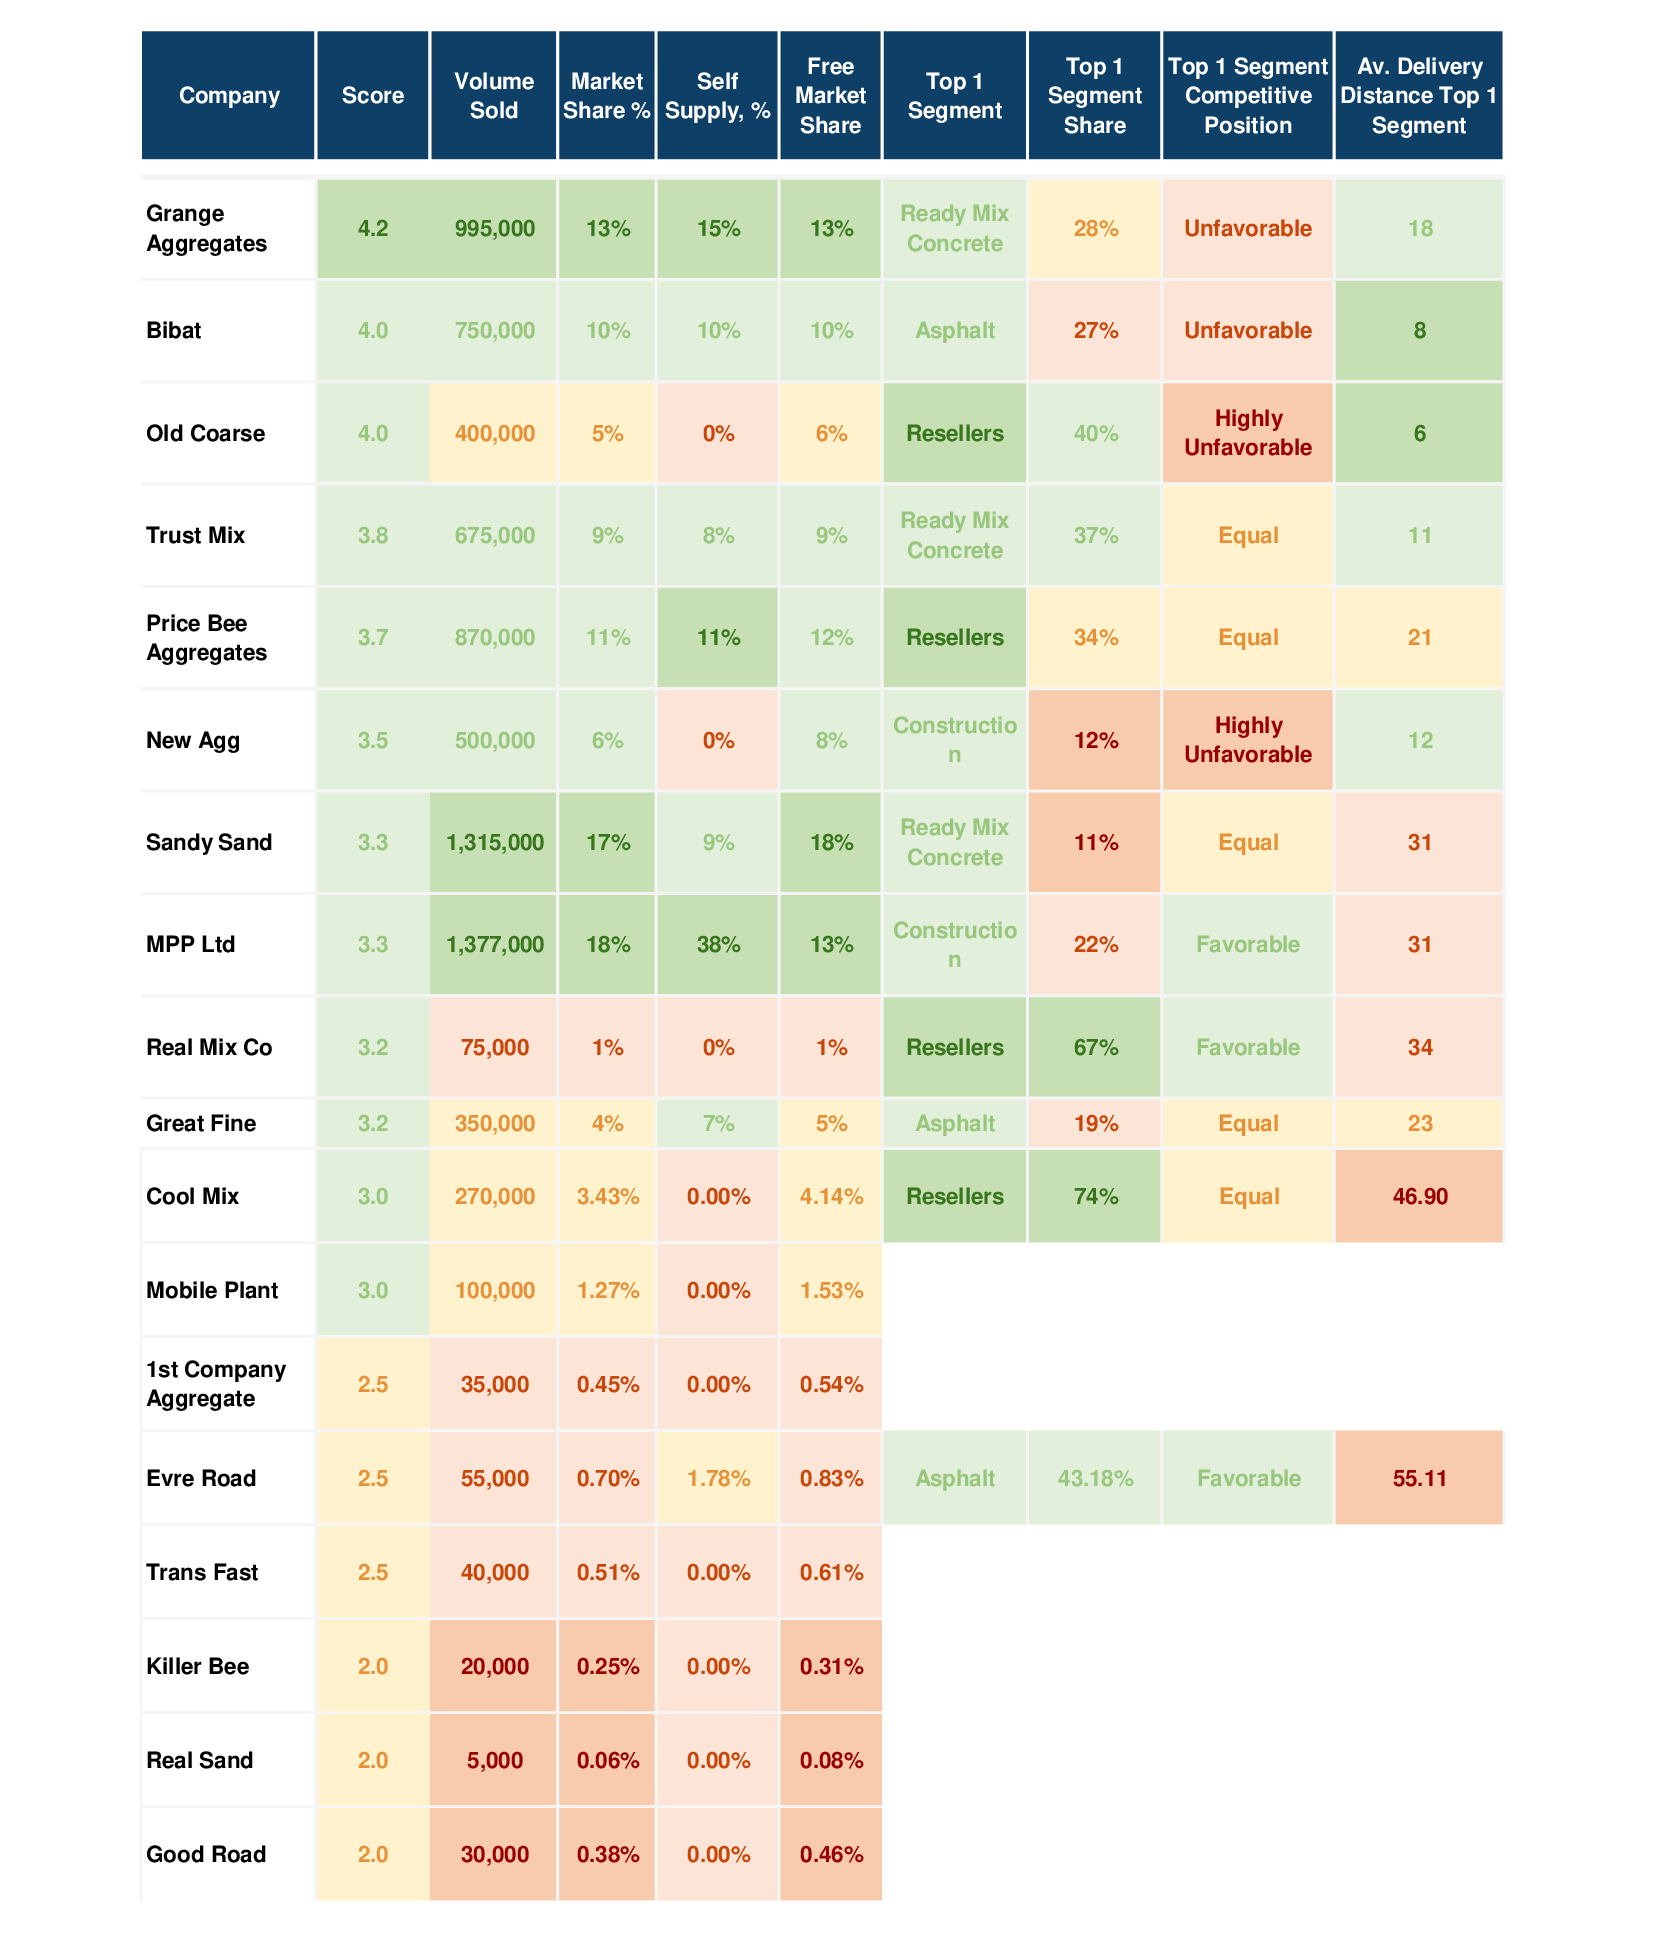
Benchmark Table: Unmasking Hidden Competitors
The benchmark table is a powerhouse for comparing market indicators among competitors and generating ratings. It challenges preconceived notions and showcases that what might appear as an outsider in one dimension could excel in others.
This aspect is crucial for challenging assumptions and directing attention to critical market players. If a company is considered less significant due to certain criteria, such as production capacity, but excels in terms of customer satisfaction or on time delivery, it transforms the way that company is perceived and prioritized.
Empowering Sales Analysis: Minimal Effort, Immersive Impact
Maintaining this information in the Market Bee is a streamlined process, requiring only one to two hours a month. However, the impact it can have on sales analysis is profound. Instead of relying on anecdotal evidence, salespersons and managers now have a wealth of data to validate their intuitions.
For instance, if a salesperson senses a potential in a particular customer-manufacturer connection, the network graph can quantify this potential through sales figures. This data-driven approach not only empowers salespersons to make confident decisions but also enables managers to steer the company towards profitable avenues.
Linking Market Assessment to Aggregates Producer Price Index. (APPI)
One of the standout discoveries for Market-Bee.com in compiling the APPI has been the volatility of pricing across many markets in the United States. With such a changing landscape of profitability, it is nearly impossible to have a consistent approach to any market and to expect the same outcomes.
Studying the latest APPI date, some great examples come to light. A sample of the half year APPI for 2023 shows wildly differing price movements. Obviously cost increases will erode the final margin, but are you selling you products to the most attractive customers or market segments? An updated market assessment will guide you through these turbulent times.
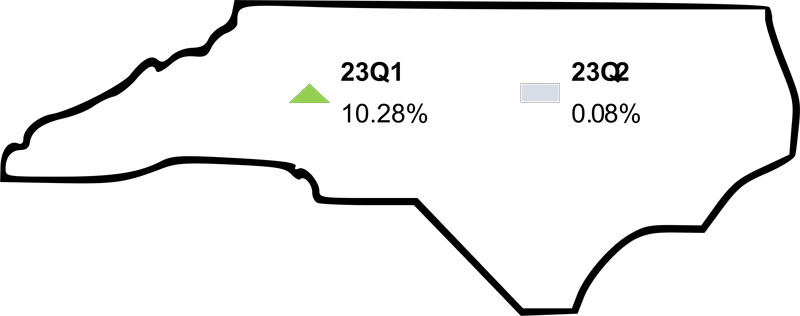
North Carolina witnessed a notable shift in its pricing dynamics during the first half of 2023. The first quarter marked a remarkable uptick with a substantial 10.23% price increase, indicating robust demand and potential supply chain challenges. However, the second quarter introduced a different narrative, as the state’s aggregates market experienced a slight deceleration with a modest 0.08% price increase. This nuanced fluctuation could be attributed to stabilizing market conditions and moderate market recovery forecasts.
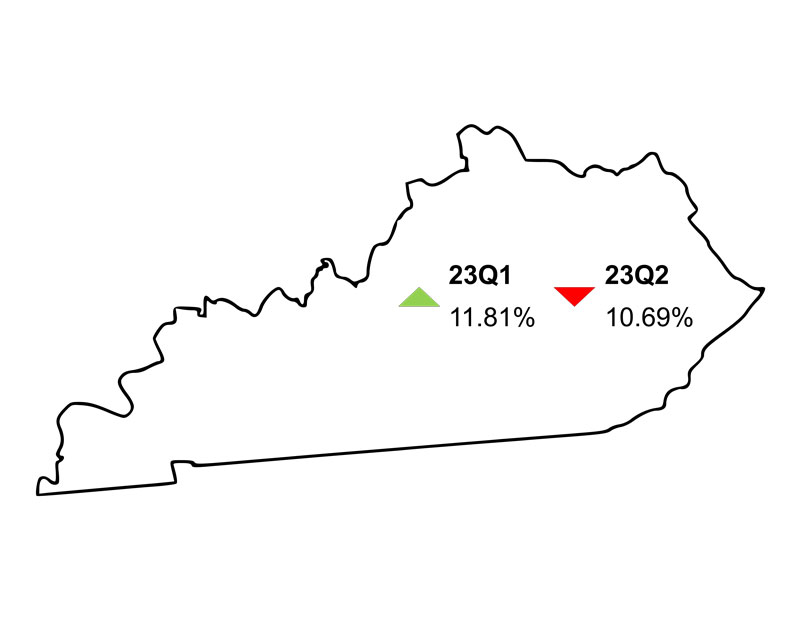
Kentucky commenced the year on a robust note, with a substantial 11.81% price surge in the first quarter. This was an indicator of anticipated mild economic growth in 2023 and forecasting of projects increasing in 2023. However, the subsequent quarter saw a contrasting narrative unfold, with a notable 10.69% price decline. This seesawing pattern could potentially be attributed to market corrections.
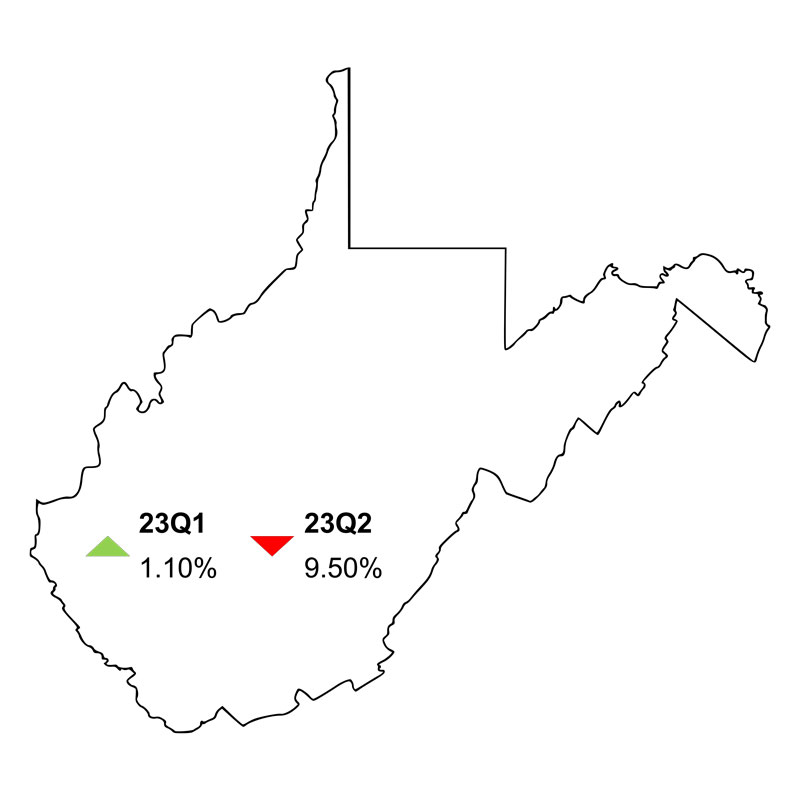
West Virginia embarked on a contrasting trajectory in the first half of 2023. The initial quarter reported a moderate 1.10% price increase, suggesting a gradual but positive market sentiment. However, the second quarter witnessed a surprising turn, with a significant -9.50% price decrease.
Market Assessments
Market assessments play a crucial role in the aggregates industry, providing valuable insights and information that drive decision-making, strategy development, and overall business success. The adoption of market assessments within this industry is of utmost importance, as it allows companies to stay competitive, identify growth opportunities, mitigate risks, and effectively allocate resources.
One of the primary reasons why market assessments are essential in the aggregates industry is their ability to provide a comprehensive understanding of the market dynamics. These assessments encompass a range of factors, including market size, growth rate, trends, customer preferences, and competitive landscape. By analyzing these elements, companies can gain insights into the demand and supply dynamics, enabling them to make informed decisions regarding production levels, pricing strategies, and capacity expansions.
Moreover, market assessments help in identifying growth opportunities. They provide an in-depth analysis of market segments, customer demographics, and emerging trends, allowing companies to tailor their products and services to meet specific customer needs. For instance, through market assessments, an aggregates company may discover a growing demand for recycled aggregates due to an increasing emphasis on sustainability. Armed with this knowledge, the company can invest in the necessary infrastructure and technologies to produce and market recycled aggregates, tapping into a new and expanding market segment.
Market assessments also enable companies to understand the competitive landscape and position themselves effectively within it. By analyzing competitors’ strengths, weaknesses, and strategies, companies can identify areas where they can differentiate themselves and gain a competitive edge. For example, a market assessment may reveal that competitors are primarily focused on price competition, leaving an opportunity for a company to differentiate through superior customer service or product quality.
Additionally, market assessments aid in risk mitigation. By understanding market trends, potential disruptions, and regulatory changes, companies can proactively plan and adapt their operations. For instance, a market assessment may reveal that a particular region heavily relies on a single source for aggregates, making it vulnerable to supply disruptions. Armed with this knowledge, an aggregates company can diversify its sourcing strategies or invest in alternative production facilities to ensure a stable supply chain.
Furthermore, market assessments facilitate effective resource allocation. By understanding market demand and growth potential, companies can make informed decisions regarding capacity expansions, equipment investments, and workforce planning. This helps prevent overcapacity or underutilization of resources, optimizing operational efficiency and profitability.
In conclusion, market assessments are vital in the aggregates industry. They provide a holistic understanding of market dynamics, identify growth opportunities, aid in competitive positioning, mitigate risks, and enable effective resource allocation. Companies that adopt market assessments gain a competitive advantage by making informed decisions and staying ahead of industry trends. In an industry driven by fluctuating demand, evolving customer preferences, and intense competition, market assessments serve as a compass, guiding companies towards sustainable growth and success. By leveraging these assessments, aggregates companies can navigate the complex market landscape, adapt to changing conditions, and thrive in an increasingly dynamic industry.
Julia Georgi and Denys Vasylenko are with Price-Bee.com.