
The U.S. Geological Survey Reports Recent Increases in Aggregates Production.
The estimated U.S. output of construction aggregates produced and shipped for consumption in the first quarter of 2020 was 464 million metric tons (Mt), an increase of 3% compared with that of the same period of 2019.
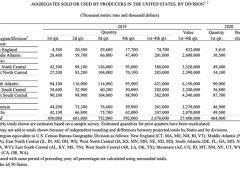
The estimated production-for-consumption of construction aggregates in the first quarter of 2020 increased in six of the nine geographic divisions compared with that sold or used in the first quarter of 2019. Production-for-consumption increased in 31 of the 41 states that were estimated.
The five leading states were, in descending order of production-for-consumption, Texas, California, Florida, Arizona and Pennsylvania. Their combined total production-for-consumption was 155 Mt and increased by 5% when compared with that of the same period of 2019.
An estimated 291 Mt of crushed stone was produced and shipped for consumption in the United States in the first quarter of 2020, a slight increase compared with that of the same period of 2019.
The estimated production-for-consumption of crushed stone in the first quarter of 2020 increased in six of the nine geographic divisions compared with that sold or used in the first quarter of 2019. Production-for-consumption increased in 32 of the 45 states for which estimates were made.
The five leading states were, in descending order of production-for-consumption, Texas, Florida, Pennsylvania, North Carolina and Georgia. Their combined total production-for-consumption was 103 Mt and decreased slightly when compared with that of the same period of 2019.
The estimated U.S. output of construction sand and gravel produced and shipped for consumption in the first quarter of 2020 was 173 Mt, an increase of 6% compared with that of the same period of 2019.
The estimated production-for-consumption of construction sand and gravel in the first quarter of 2020 increased from that of first quarter 2019 in seven of the nine geographic divisions. Production-for-consumption increased in 29 of the 45 states for which estimates were made.
The five leading states were, in descending order of production-for-consumption, Texas, California, Arizona, Washington and Florida. Their combined total production-for-consumption was 69.6 Mt and increased by 3% when compared with that of the same period of 2019.
The above estimates are based on information reported to the U.S. Geological Survey (USGS) on its quarterly sample survey by construction aggregates producers.
Shipments of portland and blended cement increased by 8% in the first quarter of 2020 compared with that in the first quarter of 2019. This information was obtained from the USGS monthly survey of U.S. cement producers.
2019 Production
The estimated annual output of construction aggregates produced for consumption in 2019 was 2.47 billion metric tons (Gt), an increase of 5% compared with that of 2018, according to Jason Willett, commodity specialist for the U.S. Geological Survey (USGS).
The estimated total annual production for consumption of construction aggregates in 2019 increased, compared with that in 2018, in 33 of the 50 states for which estimates were made.
The five leading states were, in descending order of total annual output for 2019, Texas, California, Florida, Ohio and Pennsylvania. Their combined total annual output was 740 Mt, an increase of 4% when compared with that of 2018.
An estimated 591 Mt of total construction aggregates was produced and shipped for consumption in the fourth quarter of 2019, a slight decrease compared with that of the same period of 2018.
The estimated production for consumption of construction aggregates in the fourth quarter of 2019 increased in five of the nine geographic divisions compared with that sold or used in the fourth quarter of 2018. In the fourth quarter, production for consumption increased in 17 of the 39 states for which production estimates of construction aggregates were made.
The five leading states in the fourth quarter of 2019 were, in descending order of production, Texas, California, Ohio, Florida and Missouri. Their combined total production for consumption was 179 Mt (30% of the U.S. total).
The estimated annual output of crushed stone produced for consumption in 2019 was 1.51 Gt, an increase of 6% compared with that of 2018. An estimated 360 Mt of crushed stone was produced and shipped for consumption in the fourth quarter of 2019, a slight decrease compared with that of the same period of 2018.
The estimated production for consumption of crushed stone in the fourth quarter of 2019 increased in five of the nine geographic divisions compared with that sold or used in the fourth quarter of 2018. Production for consumption increased in 23 of the 45 states for which production estimates of crushed stone were made.
The estimated annual output of construction sand and gravel produced for consumption in 2019 was 960 Mt, a slight increase compared with that of 2018. The estimated output of construction sand and gravel produced and shipped for consumption in the fourth quarter of 2019 was 230 Mt, a slight decrease compared with that of the same period of 2018.
The estimated production for consumption of construction sand and gravel in the fourth quarter of 2019 increased from fourth quarter 2018 levels in only three of the nine geographic divisions. Production for consumption increased in 19 of the 42 states for which production estimates of construction sand and gravel were made.
The above estimates are based on information reported to the USGS quarterly sample survey of construction aggregates producers in the United States.
Shipments of portland and blended cement increased slightly in the fourth quarter of 2019 compared with those of the fourth quarter of 2018. Annual consumption increased by 3% in 2019, compared with that of 2018. This information is obtained from the USGS monthly survey of U.S. cement producers.
The Rock Products Market Composite
Each year, the USGS releases its Mineral Commodity Summaries report. Published on an annual basis, this report provides industry data for more than 90 individual minerals and materials.
For the Rock Products Market Composite, we took data from six commodity segments – crushed stone, construction sand and gravel, industrial sand, cement, lime and gypsum – and combined it to calculate a market tonnage total.
For 2019, the Rock Products Market Composite is approximately 2.730 billion tons of material produced. That is compared to 2.616 billion tons of material produced in 2018, an approximate 4% increase.
Here is market data by commodity segment:
Crushed Stone
In 2019, 1.53 billion tons of crushed stone valued at more than $18.7 billion was produced by an estimated 1,430 companies operating 3,440 quarries and 176 sales and (or) distribution yards in 50 states.
Leading states were, in descending order of production, Texas, Pennsylvania, Florida, Missouri, North Carolina, Ohio, Georgia, Virginia, Illinois and Kentucky, which combined accounted for more than one-half of the total crushed stone output.
Of the total domestic crushed stone produced in 2018, about 69% was limestone and dolomite; 15%, granite; 6%, traprock; 5%, miscellaneous stone; 3%, sandstone and quartzite; and the remaining 2% was divided, in descending order of tonnage, among marble, volcanic cinder and scoria, calcareous marl, slate, and shell.
It is estimated that of the 1.6 billion tons of crushed stone consumed in the United States in 2019, 72% was used as construction aggregate, mostly for road construction and maintenance; 16% for cement manufacturing; 8% for lime manufacturing; 3% for other chemical, special, and miscellaneous uses and products; and 2% for agricultural uses.
Construction Sand and Gravel
In 2019, 970 million tons of construction sand and gravel valued at $9.0 billion was produced by an estimated 3,870 companies operating 6,830 pits and 342 sales and distribution yards in 50 states.
Leading producing states were Texas, California, Arizona, Minnesota, Michigan, Washington, Ohio, New York, Utah and Colorado, in order of decreasing tonnage, which together accounted for about 55% of total output.
It is estimated that about 46% of construction sand and gravel was used as concrete aggregates; 21%, for road base and coverings and road stabilization; 13%, as construction fill; 12%, as asphaltic concrete aggregates and other bituminous mixtures; 13%, as construction fill; and 4%, for other miscellaneous uses. The remaining 4% was used for concrete products, filtration, golf course maintenance, plaster and gunite sands, railroad ballast, road stabilization, roofing granules, and snow and ice control.
Industrial Sand and Gravel
In 2019, industrial sand and gravel valued at about $5.7 billion was produced by about 191 companies from 308 operations in 35 States. The value of production of industrial sand and gravel in 2019 decreased by 17% compared with that of the previous year, owing primarily to reduced demand for hydraulic fracturing sand. The likely cause was decreased activity in the oil and gas sector during the year.
Leading producing states were Wisconsin, Texas, Illinois, Missouri, Minnesota, Oklahoma, Mississippi, North Carolina, Iowa and Louisiana, in descending order of tonnage produced. Combined production from these states accounted for 85% of the domestic total.
About 73% of the U.S. tonnage was used as hydraulic-fracturing sand and well-packing and cementing sand; as glassmaking sand and other whole-grain silica, 7% each; as foundry sand, 3%; as ceramics, other ground silica, and whole-grain fillers for building products, 2% each; and recreational sand, 1%. Abrasives, chemicals, fillers, filtration sand, metallurgical flux, roofing granules, silica gravel, and traction sand, combined, accounted for the remaining 3% of industrial sand and gravel end uses.

Cement
In 2019, U.S. portland cement production increased by 2.5% to 86 million tons, and masonry cement production continued to remain steady at 2.4 million tons. Cement was produced at 96 plants in 34 states, and at two plants in Puerto Rico. U.S. cement production continued to be limited by closed or idle plants, underutilized capacity at others, production disruptions from plant upgrades, and relatively inexpensive imports.
In 2019, sales of cement increased slightly and were valued at $12.5 billion. Most cement sales were to make concrete, worth at least $65 billion. In 2019, it was estimated that 70% to 75% of sales were to ready-mixed concrete producers, 10% to concrete product manufactures, 8% to 10% to contractors, and 5% to 12% to other customer types. Texas, California, Missouri, Florida, Alabama, Michigan and Pennsylvania were, in descending order of production, the seven-leading cement-producing states and accounted for nearly 60% of U.S. production.
Lime
In 2019, an estimated 18 million tons of quicklime and hydrate was produced (excluding independent commercial hydrators), valued at about $2.4 billion. At yearend, 28 companies were producing lime, which included 18 companies with commercial sales and 10 companies that produced lime strictly for internal use (for example, sugar companies).
These companies had 74 primary lime plants (plants operating quicklime kilns) in 28 states and Puerto Rico. Six of these 28 companies operated only hydrating plants in 11 states.
In 2019, the five leading U.S. lime companies produced quicklime or hydrate in 21 states and accounted for about 80% of U.S. lime production. Principal producing states were, in alphabetical order, Alabama, Kentucky, Missouri, Ohio and Texas.
Major markets for lime were, in descending order of consumption, steelmaking, chemical and industrial applications (such as the manufacture of fertilizer, glass, paper and pulp, and precipitated calcium carbonate, and in sugar refining), flue gas treatment, construction, water treatment, and nonferrous mining.
Gypsum
In 2019, domestic production of crude gypsum was estimated to be 20 million tons with a value of about $160 million. The leading crude gypsum-producing states, in alphabetical order, were estimated to be Iowa, Kansas, Nevada, Oklahoma and Texas, which together accounted for an estimated 64% of total output.
Overall, 47 companies produced or processed gypsum in the United States at 52 mines in 16 states. The majority of domestic consumption, which totaled approximately 42 million tons, was used by agriculture, cement production, and manufacturers of wallboard and plaster products. Small quantities of high-purity gypsum, used in a wide range of industrial processes, accounted for the remaining tonnage.
At the beginning of 2019, the production capacity of 63 operating gypsum panel manufacturing plants in the United States was about 34.1 billion sq. ft. per year. Total wallboard sales were estimated to be 24.0 billion sq. ft.