
In This Quarterly Report, Provided Exclusively For Rock Products, Capstone Headwaters Provides Insight Into Mergers & Acquisitions (M&A), Capital Markets Trends, Aggregates Production, And Pricing Through Q1 2019.
By Darin Good and Brian Krehbiel
Capstone Headwaters’ Building Products & Construction Services Team advises industry business owners, entrepreneurs, executives, and investors in the areas of M&A, capital raising, and various special situations advisory. Due to our extensive background and laser focus within the industry, Capstone Headwaters is uniquely qualified and has an unparalleled track record of successfully representing Building Products & Construction companies.
PUBLIC VALUATION COMMENTARY
Capstone Headwaters’ Aggregates Materials Index (Figure 1) indicates that average public company EBITDA multiples remained largely unchanged from Q4 2018 at 10.3x.
|
Figure 1: Public Valuation Multiples |
||||||
|
|
US Dollars in Millions |
EBITDA |
Enterprise Value/ |
|||
|
Company Name |
TEV |
Revenue |
EBITDA |
Margin |
Revenue |
EBITDA |
|
LafargeHolcim Ltd. |
$46,186 |
$27,384 |
$5,457 |
19.9% |
1.7x |
8.5x |
|
CRH Plc |
$34,460 |
$31,605 |
$3,993 |
12.6% |
1.1x |
8.6x |
|
HeidelbergCement AG |
$25,471 |
$19,984 |
$3,077 |
15.4% |
1.3x |
8.3x |
|
Cemex SAB de CV |
$21,554 |
$14,277 |
$2,576 |
18.0% |
1.5x |
8.4x |
|
Vulcan Materials Company |
$18,682 |
$4,525 |
$1,142 |
25.2% |
4.1x |
16.4x |
|
Martin Marietta Materials, Inc. |
$15,768 |
$4,381 |
$1,084 |
24.7% |
3.6x |
14.5x |
|
MDU Resources Group, Inc. |
$7,292 |
$4,646 |
$627 |
13.5% |
1.6x |
11.6x |
|
Buzzi Unicem S.p.A. |
$5,121 |
$3,180 |
$628 |
19.7% |
1.6x |
8.2x |
|
Eagle Materials Inc. |
$4,639 |
$1,393 |
$412 |
29.6% |
3.3x |
11.3x |
|
Summit Materials, Inc. |
$3,637 |
$2,119 |
$360 |
17.0% |
1.7x |
10.1x |
|
U.S. Concrete, Inc. |
$1,385 |
$1,512 |
$172 |
11.4% |
0.9x |
8.0x |
|
Mean |
$16,745 |
$10,455 |
$1,775 |
18.8% |
2.0x |
10.3x |
|
Median |
$15,768 |
$4,525 |
$1,084 |
18.0% |
1.6x |
8.6x |
|
*TEV = Total Enterprise Value (Market Capitalization + Net Debt) |
|
|
||||
|
Sources: FactSet and Capital IQ |
||||||
AGGREGATES PERFORMANCE
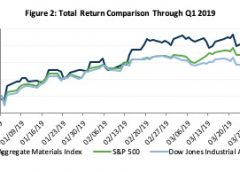
2018 Total Returns (Figure 2)
- Aggregate Materials Index – 18.9%
- S&P 500 – 13.6%
- Dow Jones Industrial Average – 11.2%
Capstone Headwaters’ Aggregates Materials Index displayed strong growth, increasing 18.9% during Q1 and outperforming the S&P 500 and Dow Jones Industrial Average.
M&A OVERVIEW
Transaction volume in the Aggregates industry (Figure 3a) has remained robust with 48 transactions announced or completed in Q1 2019, closely mirroring levels seen in Q1 2018. Steady transaction volume has occurred despite decelerating construction activity attributed to a volatile monthly pattern for construction starts. Disruption in global trade has clouded the overall US Construction outlook, as tariffs and counter measures by U.S. trading partners have increased costs and have made it difficult for contractors to accurately estimate project expenditures.
The most recent release from Dodge Data & Analytics points to a 1.0% decline in the Dodge Momentum Index in May, a leading measure for construction spending for nonresidential buildings.1 While ABC’s Construction Backlog Indicator contracted modestly in April, a healthy pipeline of building projects in the heavy industrial and infrastructure categories supports forecasts for persistent demand in the Aggregates industry.2 As the U.S. approaches a decade long economic expansion, the health of state and local government finances have resulted in more funding for infrastructure projects. Public construction has been a significant driver of growth year-to-date with spending increasing by 4.8% in April, according to the Associated General Contractors of America.3 Of this expenditure, highway and street construction experienced the largest increase at 17.2%, followed by educational construction (8.9%) and transportation construction (6.2%). While talks on the proposed $2 trillion federal infrastructure spending package have stalled, construction activity can expect continued federal funding through the FAST act as lawmakers work to reauthorize the bill before its expiration in 2020.

PRIVATE EQUITY TRANSACTION ACTIVITY & VALUATIONS
GF Data Resources, a provider of detailed information on business transactions ranging in size from $10 to $250 million, provides quarterly data from over 200 private equity firm contributors on the number of completed transactions. The following chart (Figure 4) provides the number of completed transactions from GF Data contributors, the average Total Enterprise Value (TEV)/EBITDA multiples, and the average amount of debt utilized in the transaction computed as a multiple of EBITDA. The data, although not industry specific, showed that the number of transactions declined modestly while average EBITDA multiples decreased and total debt and senior debt multiples increased compared to Q4 2018.
|
Figure 4: Private Equity Valuations & Leverage |
|||||||||
|
Q1 2017 |
Q2 2017 |
Q3 2017 |
Q4 2017 |
Q1 2018 |
Q2 2018 |
Q3 2018 |
Q4 2018 |
Q1 2019 |
|
|
# of Transactions |
67 |
58 |
53 |
71 |
76 |
48 |
70 |
63 |
57 |
|
TEV/EBITDA |
6.6x |
7.2x |
7.5x |
8.0x |
6.9x |
7.3x |
7.2x |
7.8x |
6.9x |
|
Total Debt/EBITDA |
4.0x |
4.2x |
4.4x |
4.3x |
4.1x |
3.9x |
3.7x |
3.8x |
4.1x |
|
Senior Debt/EBITDA |
3.0x |
3.6x |
3.6x |
3.4x |
3.3x |
3.2x |
2.7x |
2.9x |
3.3x |
|
Source: GF Data |
|||||||||
COMPANY SPOTLIGHT
 Vulcan Materials Company posted strong results in Q1 with total revenues increasing by 17% year-over-year with gross profit for the Aggregates segment expanding by 25%.4 Net earnings amounted to $63 million and an adjusted EBITDA of $193 million, largely attributed to strong growth in aggregates shipments (increase of 13 percent year-over-year) along with a 5.4% increase in aggregates pricing. Solid underlying fundamentals and pent-up demand carried over from 2018 drove shipment growth across Vulcan markets. Despite California’s decrease in shipments due to Q1 record rainfall, shipment growth in the state is expected to be supported by transportation-related construction and growth in Vulcan project-related bookings.
“Our first quarter results represent a good start to the year and are consistent with our full-year expectations. Broad-based shipment growth, compounding price improvements and solid operating efficiencies in our aggregates business contributed to 17% growth in total revenues and 29% growth in operating earnings. These results demonstrate the strength of our unique aggregates-centric business model,” Chairman and CEO Tom Hill commented on Q1 results in a press release.
Following positive aggregates pricing momentum and strong performance in Q1, Vulcan Materials has maintained its full year expectations for 2019 earnings from continuous operations of between $4.55 and $5.05 per diluted share and adjusted EBITDA between $1.25 and $1.33 billion.
 Martin Marietta reported records for revenues and EBITDA in Q1 2019, increasing by 17.1% and 28.2%, respectively, year-over-year.5 Factoring in acquisitions made by Martin Marietta, aggregates volume increased 24.2% and aggregates pricing saw an increase of 2.3% from Q1 2018. Martin Marietta experienced shipment growth to Nonresidential (33%), Residential (8.0%), and Infrastructure (2%) markets with the only decline in shipments to the ChemRock/Rail (-9.0%) market which was largely driven by reduced agricultural lime shipments from a depressed farm economy.
“Our company delivered strong operating and financial performance for the first three months of 2019, including first-quarter records for revenues and EBITDA. Driven by improved shipments, pricing and cost management, we are off to a promising start to what we expect to be another record year for Martin Marietta. Notably, the Building Materials business benefited from robust pent-up demand as well as modestly improved weather across portions of our geographic footprint, which allowed for an early beginning to the construction season,” Ward Nye, Chairman, President and CEO of Martin Marietta stated in a press release.
Based on Martin Marietta’s latest earnings along with current trends and expectations, it has reaffirmed its full-year guidance forecasting high-single digit growth in Infrastructure shipments, mid-to-high single digit growth in Nonresidential and Residential shipments, and a slight increase in ChemRock/Rail shipments.
NOTABLE TRANSACTIONS
 |
| Aquires |
 |
Votorantim Cimentos North America, Inc. acquires United Materials, LLC
(March 2019, Undisclosed)
Votorantim Cimentos North America has acquired United Materials, a supplier of ready-mix concrete, aggregates, and building materials, for an undisclosed amount. Votorantim Cimentos North America operates as a subsidiary of Brazil-based Votorantim Cimentos, one of the world’s largest cement companies with approximately 12,000 employees.6
Founded in 1998 through the merger of three companies, United Materials operates four ready-mix concrete plants, one aggregate quarry and two building material units in the western part of New York. The Depew, New York based construction materials provider serves both the commercial and residential markets and has 140 employees that will be retained by the new ownership. The acquisition expands Votorantim’s existing business portfolio and strengthens its presence in the Great Lakes region.
|
|
| Aquires |
 |
Ply Gem Industries, Inc. acquires Environmental Materials, LLC
(January 2019, $186 Million)
Ply Gem Industries, a wholly-owned subsidiary of NCI Building Systems (NYSE:NCS), has acquired Environmental Materials (doing business as Environmental StoneWorks) for an enterprise value of $186 million. Environmental Materials is the only national manufacturer and installer of stone veneer for residential and commercial markets. It possesses five manufacturing facilities, 21 installation centers, and approximately 660 employees.7
NCI, parent company of Ply Gem, is a premier exterior building products manufacturer with a broad range of products that serve residential and commercial markets. The acquisition of Environmental Materials positions NCI as a national market leader in stone veneer.
CONSTRUCTION MATERIALS UPDATE
Construction input prices (Figure 5) increased 1.7% in March and are up 2.5% on a year-over-year basis, according to an Associated Builders and Contractors (ABC) analysis of data recently released by the U.S. Bureau of Labor Statistics.

AGGREGATES MATERIALS
Industry results in Q1 2019 showed year-over-year increases in volume for crushed stone (11.5%) and sand & gravel (2.4%). Additionally, ready-mixed concrete and cement experienced increases in prices when compared to the 2018 averages.
 Cement
- Portland cement consumption (19.4 million metric tons) increased 15.2% year-over-year during Q1 2019.
- The average net selling price per ton for Martin Marietta and Eagle Materials in Q1 2019 was $110.0, an increase of 0.7% over the prior quarter. Compared to Q1 2018, average net selling price increased by 2.0% in Q1 2019.
 Ready-Mix Concrete
- Ready-Mix Concrete (RMC) prices increased 0.2% in Q1 2019 when compared to Q4 2018 and 1.5% year-over-year. Price data is computed from the average RMC net selling prices of US Concrete, Vulcan Materials, Martin Marietta and Eagle Materials.
- Ready-mix concrete volume for Q1 2019 amounted to 71 million cubic yards, a 2.4% increase compared to the same period in 2018.
 Asphalt
- Asphalt prices increased 1.0% year-over-year in Q1 2019, as measured by the average net asphalt selling prices of Vulcan Materials and Martin Marietta. Asphalt prices declined 4.2% during Q1 2019 when compared to the previous quarter.
- Asphalt volume for 2018 and Q1 2019 has not yet been reported.
 Crushed Stone
- An estimated 281 million metric tons of crushed stone were produced and shipped to the U.S. for consumption in Q1 2019.
- Crushed stone production increased 11.5% in Q1 2019 when compared to Q1 2018. Crushed stone production volume declined by 21.9% compared to the previous quarter.
- Crushed stone prices for Q1 2019 have not yet been reported.
 Sand & Gravel
- An estimated 168 million metric tons of sand & gravel were produced and shipped to the U.S. for consumption in Q1 2019.
- Sand & gravel production in Q1 2019 increased 2.4% year-over-year, the seventh consecutive quarterly increase when compared to the same period the prior year.
Citations
1. Dodge Data & Analytics, “Doge Momentum Index Falls in May,” https://www.construction.com/news/dodge-momentum-index-falls-may-june-2019, accessed June 18, 2019.
2. Associated Builders and Contractors, “ABC’s Construction Backlog Indicator Contracts in April,” https://www.abc.org/News-Media/News-Releases/entryid/16548/abc-s-construction-backlog-indicator-contracts-in-april, accessed June 18, 2019.
3. The Associated General Contractors of America, “Construction Spending Diverges in April as Public Sector Investment Surges, Private Nonresidential Projects Slip and Single-Family Homebuilding Stalls,” https://www.agc.org/news/2019/06/03/construction-spending-diverges-april-public-sector-investment-surges-private, accessed June 17, 2019.
4. Vulcan Materials Company, “Vulcan Announces First Quarter 2019 Results,” https://ir.vulcanmaterials.com/investor-relations/news-releases/news-details/2019/Vulcan-Announces-First-Quarter-2019-Results/default.aspx, accessed June 12, 2019.
5. Martin Marietta, “Martin Marietta Reports First Quarter 2019 Results,” http://ir.martinmarietta.com/static-files/dae8766b-ee3e-4062-930a-d9025413351e, accessed June 12, 2019.
6. The Buffalo News, “United Materials cements deal for new ownership,” https://buffalonews.com/2019/03/20/united-materials-cements-deal-for-new-ownership/, accessed June 13, 2019.
7. PR Newswire, “NCI Building Systems Announces Closing of Ply Gem’s Acquisition of Environmental Materials, LLC,” https://www.prnewswire.com/news-releases/nci-building-systems-announces-closing-of-ply-gems-acquisition-of-environmental-materials-llc-300799121.html, accessed June 13, 2019.
Capstone Headwaters is an elite investment banking firm dedicated to serving the corporate finance needs of middle market business owners, investors and creditors. Capstone Headwaters provides merger & acquisition, private placement, corporate restructuring and financial advisory services across 16 industry verticals to meet the lifecycle needs of emerging enterprises. Headquartered in Boston, MA and Denver, CO, Capstone Headwaters has 19 offices in the US, UK and Brazil with a global reach that includes over 450 professionals in 40 countries. For more information, visit www.capstoneheadwaters.com. To discuss any information contained in this report, contact the Capstone Headwaters team: Darin Good, managing director, [email protected], 303-549-5674; Brian Krehbiel, senior vice president, [email protected], 970-215-9572; Crista Gilmore, vice president, [email protected], 303-531-5013; Dominic Cervi, vice president, [email protected], 303-531-4605.