
Rock Products’ Annual Survey on the Opinions, Concerns and Buying Intentions of Producers Reveals What Is on the Industry’s Collective Mind.
By Mark S. Kuhar
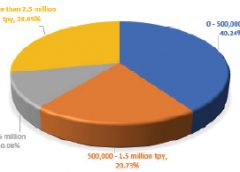
| What is your company’s annual production capacity? |
|
|
| Do you have adequate reserves for future production? |
 |
| In which geographic region(s) do you operate? |
 |
| What is your primary product? |
 |
| What limits your company’s access to reserves? |
 |
| What is your company’s capital expenditure budget for 2017? |
 |
|
Going into 2018, how would you describe the attitude in the aggregates industry compared with 2017? |
 |
| For 2017, how did total aggregates production compare to 2016? |
 |
President Trump has just proposed a $1.5 trillion infrastructure plan. Much of the money is sourced from state and local budgets and no increase in the gas tax was proposed, disappointing many transportation advocates. But despite this, aggregates producers are looking ahead confidently to the 2018 production season, seeking to build on a somewhat slow 2017 characterized by production reductions in many markets due to inclement weather and in some cases, natural disasters.
As 2017 closed out, the estimated seasonally adjusted annual rate of public construction spending was $290.0 billion, 0.3 percent (±1.5 percent) above the revised November estimate of $289.1 billion. Highway construction was at a seasonally adjusted annual rate of $88.3 billion, 0.3 percent (±3.5 percent) above the revised November estimate of $88.0 billion.
Highway and bridge construction starts grew 7 percent in 2017, strengthening after a 9 percent decline in 2016. The top five states in 2017 ranked by the dollar amount of new highway and bridge construction starts, with their percent change from the previous year, were – Texas, down 20 percent; California, up 9 percent; Virginia, up 180 percent; Florida, up 23 percent; and Pennsylvania, up 32 percent.
This month, we share the results of our fifth annual, exclusive Rock Products survey, Benchmark 2018. This survey not only offers the opportunity to gauge current producer opinion, we can also compare to previous years to see what is the same and what is different.
So who took the survey this year? A typical survey respondent was, on average, a production manager, foreman or technical superintendent (37 percent) up from 32 percent last year. Company officers, executives, owners or partners also took part in the survey (25 percent). Sales executives, geologists, safety directors and others also participated in the survey.
What types of operations are reflected by this year’s survey respondents? Operations cranking out up to 500,000 tpy (40 percent) were highly represented, up from 38 percent last year. Plants producing more than 2.5 million tpy (28 percent) came next. Plants producing 500,000 to 1 million tpy (21 percent) followed and plants producing 1.5 to 2.5 million tpy (11 percent) brought up the rear.
The number of survey participants from producers of both crushed stone, and sand and gravel decreased this year (38 percent) from last year (44 percent), but producers of crushed stone alone rose (23 percent). Producers of specialty minerals and frac sand made up more than 15 percent of respondents. Geographic location was dominated by the Midwest, Southeast and Northeast, with additional strong response coming from the Southwest.
Big Issues
When it comes to the key issues facing aggregates producers, the big “number-one” identified by survey participants this year represents a return to the past. Making a jump back into the top spot was the transportation economy, surpassing the national economy, which topped the list last year. That issue was front and center during the great recession, but has now dropped to 6th place on the list.
Environmental regulations, always a top concern, was number two on this year’s list, followed by permitting and transportation funding. Labor also merited respondent concern, creeping up the list, which is no surprise given recent reports of construction industry labor shortages.
Here are the top 15 main concerns of aggregates producers who took our survey.
1. Construction economy, 47.56 percent.
2. Environmental regulations, 42.68 percent.
3. Permitting, 36.59 percent.
4. Transportation Funding, 34.15 percent.
5. Labor, 32.93 percent.
6. National economy, 25.61 percent.
7. Energy costs, 21.95 percent.
8. Healthcare, 17.07 percent.
9. Safety regulations (MSHA), 15.85 percent.
10. Insurance, 14.63 percent.
11. Transportation, 12.20 percent.
12. Liability costs (legal), 10.98 percent.
13. Trump Transportation Program, 9.76 percent.
14. Equipment capitalization, 6.10 percent.
15. Credit, 3.66 percent.
16. Other, 3.66 percent.
Impacting the Industry
Respondents were asked the question “What will impact the U.S. aggregates industry the most in the near future?”
One respondent told us emphatically, “Environmental groups and government regulations (EPA). We need to get ahead of these negative impacts by educating the public with facts, by electing congressman and senators who actually care about the American people, by pressing our congressionals to abolish or at the very least make positive changes to the Equal Justice Act and perhaps by getting Congress to run rough shod on the EPA.”
Another respondent took it to the next extreme, declaring, “MSHA needs to be done away with. It is a form of Communism, where they are right all the time and we are always at fault. There is no place in America for an outfit like MSHA to exist.“ But yet another survey respondent took a more measured approach, stating, “The Trump era has increased litigation. He should be working to balance environmental and fiscal issues.”
“The Highway Trust Fund needs to be revamped due to mandated fuel economy standards and electric vehicles,” one respondent told us. “Our state needs to get a handle on funding for our highway program.”
Permitting and what was referred to as “neighbor issues” was also on the mind of some producers. “Continued increases in permitting and zoning restrictions is a big problem,” it was noted. “Prepare by increasing awareness of aggregate needs in communities through outreach.” One respondent thought that communities should “protect lands that contain quality deposits from being built on until deposits are mined out and reclaimed.”
Labor was noted by several respondents. “Experienced labor, or the lack thereof continues to be an issue. Autonomous mining needs to be in the forefront to allow for cost savings.”
One respondent cast a wide net, noting industry issues as diverse as “equipment costs, fuel and labor costs, rising healthcare and insurance.”
Equipment Capitalization
With an eye on a new federal infrastructure bill, producers plan to spend some money in 2018, building on 2017. About 54 percent of survey respondents reported an increase in their company’s capital expenditures for 2018.
This year approximately 28 percent of the survey group plan to spend up to $500,000. About 24 percent plan to spend $1 million to $5 million this year. Another 23 percent of the survey group planned to spend $5 million to $10 million. Approximately 21 percent planned to spend $500,000 to $1 million, a nice jump from 2018 when 16 percent chose that dollar range.
And what do they plan to buy?
- Equipment upgrades, 59.76 percent.
- New equipment, 58.54 percent.
- Plant additions, 34.15 percent.
- Used equipment, 25.61 percent.
- Mine development, 23.17 percent.
- Technology upgrades, 21.95 percent.
- Permitting and bonding, 20.73 percent.
- New plant construction, 19.51 percent.
- Quality control, 13.41 percent.
- Exploration, 10.98 percent.
- New mine start up, 10.98 percent.
- Reclaim systems, 8.54 percent.
- Other, 1.22 percent.
Over and above consumables, such as oil, safety supplies, maintenance equipment, tires and replacement parts, the top equipment areas being considered for 2018 are:
- Motors, 52.44 percent.
- Pick-up/Utility Vehicles, 50.00 percent.
- Pumps, 40.24 percent.
- Material handling/Conveying equipment, 46.38 percent.
- Screening and sizing equipment, 46.30 percent.
- Drilling and blasting suppliers/Services, 32.93 percent.
- Excavators/loaders/dredges, 39.02 percent.
- Portable crushing/screening plants, 29.30 percent.
- Washing and classifying equipment, 29.24 percent.
- Haul trucks, 24.44 percent.
- Scales, 24.39 percent.
- Breakers, 24.33 percent.
- Crushers, 21.95 percent.
- Automation products, 21.95 percent.
- Drones, 14.63 percent.
- Energy management, 10.98 percent.
- Frac sand equipment, 3.66 percent.
- Other, 2.44 percent.
Looking Ahead
Aggregates producers are pretty confident right now that they are sitting on an acceptable amount of reserves for the foreseeable future. About 66 percent of respondents said they have adequate reserves. When asked what limits their access to reserves, respondents cited permitting issues, followed by access to materials and a limited quantity of materials.
In addition, 30 percent of respondents said their plants would operate at 80 to 90 percent capacity in 2018. About 27 percent of respondents said their plants would operate at 90 to 100 percent capacity.
When asked to describe the attitude in the aggregate industry in 2018, the answer is clear. Producers are feeling good about their prospects going forward, with a strong 65.85 percent saying they are “more optimistic.” That number is actually down from last year when more than 70 percent noted their optimism. But the good news is, only about 3 percent are pessimistic.
About 60 percent of aggregates producers expect their total production to increase this year.
Statistics based on information gathered by more than 200 respondents who accessed the survey.