
In This Updated Analysis Prepared For Rock Products, Headwaters MB Looks At Fourth-Quarter 2015 Market Trends Such As Mergers, Stone Production And Pricing.
By Brian Krehbiel
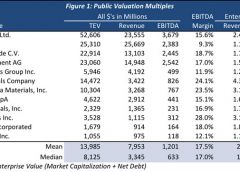
A handful of large publicly traded companies control the worldwide aggregates industry. In Q4 2015, valuation multiples for the publicly traded aggregates industry declined 2.5% and average EBITDA margins fell from 18.0 percent to 17.5 percent compared to Q3, 2015 (Figure 1, includes the constituents of Headwaters Aggregates Materials Index). Year over year, valuation multiples declined by 2.5 percent while EBITDA margins widened to 17.5 percent from 16.5 percent. The publicly traded aggregates industry as a whole was trading at an average EBITDA multiple of 11.2x at the end of Q4, 2015.
|
|
| Source: Capital IQ |
Aggregate Materials Index – Company Spotlight
International and domestic aggregates providers experienced growth in revenue and margins in 2015. Acquisitions played an important role in the 2015 growth story.
![]() CRH plc recently announced its Q4 2015 and annual results. In the company’s press release, CEO Albert Manifold stated, “As a result of good performance from our heritage businesses and contributions from acquisitions, 2015 was a year of significant profit growth for CRH.” Revenue increased 25.0 percent and operating profit was up 39.0 percent over 2014. CRH completed 20 acquisitions in 2015. Significant transactions included the acquisition of certain assets from Lafarge S.A. and Holcim Ltd, providers of cement, aggregates, ready-mix concrete, concrete and asphalt products, for a total consideration of €6.5billion.
CRH plc recently announced its Q4 2015 and annual results. In the company’s press release, CEO Albert Manifold stated, “As a result of good performance from our heritage businesses and contributions from acquisitions, 2015 was a year of significant profit growth for CRH.” Revenue increased 25.0 percent and operating profit was up 39.0 percent over 2014. CRH completed 20 acquisitions in 2015. Significant transactions included the acquisition of certain assets from Lafarge S.A. and Holcim Ltd, providers of cement, aggregates, ready-mix concrete, concrete and asphalt products, for a total consideration of €6.5billion.
![]() U.S. Concrete Inc. recently announced Q4 2015 and annual results, reporting a 38.5 percent increase in annual revenue. Revenue for the company’s largest division, ready-mixed concrete, also increased 38.5 percent when compared to 2014. As a whole, the adjusted EBITDA margin improved from 11.0 percent to a company record of 13.5 percent. In the press release, U.S. Concrete cited acquisitions as an important driver of growth. Of note, U.S. Concrete acquired Heavy Materials LLC and Spartan Concrete Products LLC, two strategically integrated companies located in the U.S. Virgin Islands, serving key Caribbean markets.
U.S. Concrete Inc. recently announced Q4 2015 and annual results, reporting a 38.5 percent increase in annual revenue. Revenue for the company’s largest division, ready-mixed concrete, also increased 38.5 percent when compared to 2014. As a whole, the adjusted EBITDA margin improved from 11.0 percent to a company record of 13.5 percent. In the press release, U.S. Concrete cited acquisitions as an important driver of growth. Of note, U.S. Concrete acquired Heavy Materials LLC and Spartan Concrete Products LLC, two strategically integrated companies located in the U.S. Virgin Islands, serving key Caribbean markets.
Merger and Acquisition Activity
Acquisition activity continued in Q4 2015 as aggregate producers acquired mineral reserves and completed strategic acquisitions to increase vertical integration and geographic expansion (Figure 2).
 Private Equity Transaction Activity and Valuations
GF Data, a provider of detailed information on business transactions ranging in size from $10 million to $250 million, provides quarterly data from more than 200 private equity firm contributors on the number of completed transactions. Figure 3 provides the number of completed transactions from GF Data contributors, the average EBITDA multiple and the average amount of debt utilized in the transaction computed as a multiple of EBITDA. The data, although not industry specific, does show valuations and leverage declined in Q4 2015 but the number of transactions was consistent with Q4 2014.
| Figure 3: Private Equity Valuations & Leverage | ||||||||
| All Transactions | Q1 2014 | Q2 2014 | Q3 2014 | Q4 2014 | Q1 2015 | Q2 2015 | Q3 2015 | Q4 2015 |
| # of Transactions | 41 | 53 | 50 | 64 | 63 | 51 | 37 | 62 |
| TEV/EBITDA | 6.4x | 6.6x | 6.7x | 7.0x | 7.0x | 6.4x | 7.1x | 6.5x |
| Total Debt/EBITDA | 3.6x | 4.0x | 3.7x | 3.7x | 4.0x | 4.0x | 4.1x | 3.8x |
| Senior Debt/EBITDA | 2.4x | 2.9x | 2.7x | 2.7x | 3.3x | 2.9x | 3.2x | 2.6x |
| Source: GF Data | ||||||||
Aggregates Performance
Over the past 10 years, major market indices outpaced growth in the aggregates industry (Figure 4), due in large part to the recession, but the aggregate industry has grown consistently since 2011. In 2015 publicly traded aggregates producers narrowly outperformed the S&P 500 and the Dow Jones Industrial Average (DJIA) (Figure 5). Publicly traded aggregates producers were performing well in early 2015, peaked in June, then surrendered all gains in the second half before a slight recovery in December.
 |
| Source: S&P Capital IQ |
 |
| Source: S&P Capital IQ |
Industry Spotlight
The Dodge Momentum Index is a monthly measure of the first (or initial) report for nonresidential building projects in planning, which have been shown to lead construction spending for nonresidential buildings by a full year. In 2015, the Dodge Momentum Index climbed 2.4 percent. Institutional building led the growth but the momentum index was slowed by contraction in commercial building. The index is a leading indicator and 2015 results imply nonresidential construction activity will continue to drive aggregate demand in 2016.
| Figure 6: Dodge Momentum Index | |||
| (Year 2000=100) | |||
| Dec-14 | Dec-15 | % Change | |
| Dodge Momentum Index | 122.4 | 125.2 | 2.4% |
| Commercial Building | 132.0 | 123.1 | -6.7% |
| Institutional Building | 110.4 | 127.9 | 15.8% |
| Source: Dodge Data & Analytics | |||
Aggregates Material Trends
Industry results in 2015 once again show increased year over year pricing and volume for cement, ready-mix concrete, asphalt, crushed stone, and sand & gravel.
Cement
Total shipments of portland and blended cement in the United States and Puerto Rico for the year through December totaled 91.5 million tons, up by 3.5 percent from the full year 2014.1
Ready-Mix Concrete
Ready-mix concrete prices have risen at a CAGR of 5.4 percent over the last two years while production levels have grown less than 1.0 percent annually.
Crushed Stone
In 2015, 1.32 billion metric tons of crushed stone valued at more than $13.8 billion was produced by 1,430 companies operating 3,700 quarries, 82 underground mines, and 187 sales/distribution yards in 50 States.1
Sand & Gravel
Construction sand and gravel valued at $7.2 billion was produced by an estimated 4,100 companies and government agencies from about 6,300 operations in 50 States. It is estimated that about 45 percent of construction sand and gravel was used as concrete aggregates; 25% for road base and coverings and road stabilization; 13% as asphaltic concrete aggregates and other bituminous mixtures and 12% as construction fill.1
1 U.S. Geological Survey
 |
| Source: U.S. Geological Survey |
 |
| Sources: NRMCA Industry Data Survey, Average RMC selling price of U.S. Concrete, Vulcan Materials, Martin Marietta Materials & Eagle Materials |
 |
| Sources: EAPA Asphalt in Figures, Vulcan Materials & Martin Marietta Materials average of net asphalt selling prices |
 |
| Source: U.S. Geological Survey |
 |
| Source: U.S. Geological Survey |
Headwaters MB is an independent, middle-market investment banking firm providing strategic merger and acquisition, corporate finance, and merchant banking services through proprietary sources of capital. Named “Investment Bank of the Year” by The M&A Atlas Awards in 2015, Headwaters MB is headquartered in Denver, with six regional offices across the United States and partnerships with 18 firms covering 30 countries. For more information, visit www.headwatersmb.com. To discuss any information contained in this report, contact the Headwaters MB team: Darin Good, managing director, [email protected], 303-549-5674; Brian Krehbiel, vice president, [email protected], 303-531-5008.