
In This Quarterly Report, Provided Exclusively To Rock Products, Capstone Headwaters Provides Insight Into Merger & Acquisitions (M&A), Capital Markets Trends, Aggregate Production And Pricing Through Q2 2018.
By Darin Good and Brian Krehbiel
Capstone Headwaters’ Building Products & Construction Services Team advises industry business owners, entrepreneurs, executives and investors in the areas of merger and acquisitions, capital raising and various special situations advisory. Due to its background and laser focus within the industry, Capstone Headwaters is uniquely qualified and has an unparalleled track record of successfully representing building products and construction companies.
PUBLIC VALUATION COMMENTARY
Figure 1 includes the constituents of Capstone Headwaters Aggregates Materials Index as of 6/30/2018. Average EBITDA multiples increased from 12.1x at the end of Q1 2018 to 14.4x at the end of Q2 2018.
|
Figure 1: Public Valuation Multiples |
||||||
|
|
US Dollars in Millions |
EBITDA |
Enterprise Value/ |
|||
|
Company Name |
TEV |
Revenue |
EBITDA |
Margin |
Revenue |
EBITDA |
|
LafargeHolcim Ltd. |
46,789 |
26,656 |
1,284 |
4.8% |
1.76x |
36.4x |
|
CRH Plc |
39,762 |
30,054 |
3,733 |
12.4% |
1.32x |
10.7x |
|
Cemex SAB de CV |
23,877 |
14,212 |
2,583 |
18.2% |
1.68x |
9.2x |
|
HeidelbergCement AG |
29,870 |
20,578 |
3,125 |
15.2% |
1.45x |
9.6x |
|
MDU Resources Group, Inc. |
7,437 |
4,479 |
633 |
14.1% |
1.66x |
11.7x |
|
Vulcan Materials Company |
20,376 |
4,127 |
1,034 |
25.0% |
4.94x |
19.7x |
|
Martin Marietta Materials, Inc. |
17,331 |
4,063 |
1,038 |
25.5% |
4.27x |
16.7x |
|
Buzzi Unicem S.p.A. |
5,515 |
3,255 |
616 |
18.9% |
1.69x |
9.0x |
|
Summit Materials, Inc. |
4,747 |
2,040 |
402 |
19.7% |
2.33x |
11.8x |
|
Eagle Materials Inc. |
5,652 |
1,414 |
420 |
29.7% |
4.00x |
13.5x |
|
U.S. Concrete, Inc. |
1,614 |
1,428 |
156 |
10.9% |
1.13x |
10.3x |
|
Mean |
18,452 |
10,209 |
1,366 |
17.7% |
2.4x |
14.4x |
|
Median |
17,331 |
4,127 |
1,034 |
18.2% |
1.7x |
11.7x |
|
*TEV = Total Enterprise Value (Market Capitalization + Net Debt) |
||||||
| Source: FactSet | ||||||
Aggregates Performance
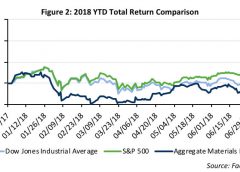
2018 YTD Total Returns (Figure 2)
- Aggregate Materials Index – (5.2%)
- S&P 500 – 2.6%
- Dow Jones Industrial Average – (1.8%)
Our Aggregates Materials Index significantly underperformed the S&P 500 and the DJIA, declining by 5.2 percent YTD.
M&A OVERVIEW
Preliminary estimates of total acquisition activity (Figure 3) in Q2 2018 demonstrate a decrease of 5.3 percent compared to the same period in 2017 in terms of the number of aggregates related transactions completed (36) in the U.S. and Canada. Transaction activity was, however, up 24.1 percent compared to Q1 2018. It is common for transaction activity to dip in Q1 after a large transaction push at year-end and then pick up again in Q2. Publicly traded aggregates producers were notably active during the quarter including CRH plc, Martin Marietta Materials, Inc, and Summit Materials, Inc.
|
Figure 3: Select Q2 2018 Industry M&A Activity |
|||
|
Transaction Date |
Target/Issuer |
Buyers/Investors |
Transaction Value ($mm) |
|
06/24/18 |
Grupo Cementos de Chihuahua, S.A.B. de CV Ready Mix Concrete Operations |
CRH plc |
$118.5 |
|
06/03/18 |
Maddaloni Cement S.r.l. |
Colacem S.p.A. |
$46.7 |
|
05/23/18 |
Kitsap Reclamation and Materials, Inc. |
ACG Materials, LLC |
Undisclosed |
|
05/20/18 |
Century Textiles and Industries Limited Cement Division |
UltraTech Cement Limited |
$1,233.3 |
|
05/01/18 |
EP Minerals, LLC |
U.S. Silica Holdings, Inc. |
$750.0 |
|
04/30/18 |
Superior Ready Mix, Inc. |
Summit Materials, Inc. |
Undisclosed |
|
04/27/18 |
Bluegrass Materials Company, LLC |
Martin Marietta Materials, Inc. |
$1,625.0 |
|
04/25/18 |
Mallard Sand & Gravel Business of CRH Americas, Inc. |
Martin Marietta Materials, Inc. |
Undisclosed |
|
04/20/18 |
Lagan Group Holdings Ltd |
Breedon Group plc |
$650.5 |
|
04/02/18 |
Mitsui & Co., Ltd., Iron and Steel Products Business |
Nippon Steel & Sumikin Bussan Corporation |
$532.8 |
| Sources: FactSet and Capital IQ | |||
Private Equity Transaction Activity & Valuations
GF Data Resources, a provider of detailed information on business transactions ranging in size from $10 million to $250 million, provides quarterly data from over 200 private equity firm contributors on the number of completed transactions. Figure 4 provides the number of completed transactions from GF Data contributors, the average Total Enterprise Value (TEV)/EBITDA multiple and the average amount of debt utilized in the transaction computed as a multiple of EBITDA. The data, although not industry specific, shows transaction activity declining sharply from high levels achieved during the prior quarter while average valuation multiples rebounded from 6.8x in Q1 2018 to 7.4x in Q2.
|
Figure 4: Private Equity Valuations & Leverage |
|||||||||
|
Q2 2016 |
Q3 2016 |
Q4 2016 |
Q1 2017 |
Q2 2017 |
Q3 2017 |
Q4 2017 |
Q1 2018 |
Q2 2018 |
|
|
# of Transactions |
76 |
36 |
57 |
65 |
57 |
52 |
70 |
63 |
47 |
|
TEV/EBITDA |
7.1x |
6.6x |
6.8x |
6.6x |
7.2x |
7.6x |
8.0x |
6.8x |
7.4x |
|
Total Debt/EBITDA |
3.9x |
3.8x |
3.7x |
4.0x |
4.2x |
4.5x |
4.3x |
4.2x |
3.9x |
|
Senior Debt/EBITDA |
3.3x |
3.2x |
2.8x |
3.0x |
3.6x |
3.7x |
3.5x |
3.4x |
3.2x |
| Source: GF Data | |||||||||
Notable Transactions
Several notable transactions were completed or announced in the industry during Q2 2018. One of the more notable aggregates industry transactions is highlighted below.
 U.S. Silica Holdings, Inc. acquired EP Minerals, LLC
(May 1, 2018, $750.0 million)
Bryan Shinn, U.S. Silica Holdings’ Chief Executive Officer, commented: “This transformative acquisition achieves a key corporate objective to diversify our profit sources and add additional EBITDA from a broader industrial space to better balance our portfolio opposite our more cyclical Oil and Gas business. EP Minerals has a very attractive market structure, is a business with strong margins and very consistent cash flows with numerous growth opportunities and a robust pipeline of new products. Bottom line, this is a very diverse company with a rare combination of advantages and strengths and we are excited about the opportunity to work with the EP Minerals team to continue to grow its market-leading business.‘’ 3
![]() COMPANY SPOTLIGHT
COMPANY SPOTLIGHT
Total revenues for Vulcan Materials increased by 16 percent to $1.2 billion in Q2 2018 compared to the prior year period. The increase in revenue was primarily due to strong aggregates shipment growth. Adjusted EBITDA increased to $325 million in the second quarter 2018, versus $288 million in the prior year period.
“We remain on track with our full year expectations,” stated Tom Hill, Chairman and CEO of Vulcan Materials Company. “Vulcan-served markets are experiencing stronger growth in demand than other markets, and higher public funding for transportation infrastructure is now converting to higher shipments of aggregates. Apart from geographic mix impacts, our pricing momentum continues to strengthen, including in our backlogged work. Our operating disciplines remain strong, and margins should continue to improve as we turn the corner on costs related to last year’s storms.” 1
Vulcan’s aggregates business experienced an increase of $139 million in sales due to the 15 percent increase in shipments versus the prior year quarter.
 MDU Resources’ construction materials business had earnings of $24.3 million in the second quarter, compared to $21.3 million for the same period in 2017. The increase in earnings was a result of the federal tax reform. The company also expanded their construction materials business by acquiring Teevin & Fischer Quarry LLC and Tri-City Paving Inc. during the second quarter. Both acquisitions are expected to be accretive to 2018 earnings. MDU Resources Group is using acquisitions to gain market share and remain competitive in the consolidating aggregates industry.
“We are pleased with our ongoing growth and solid operational execution,” said David L. Goodin, president and CEO of MDU Resources. “Our construction services business is experiencing an exceptional year, with to-date earnings nearly fifty percent higher than last year. We had a record combined backlog of $1.62 billion of work at our construction services and construction materials businesses at the end of the second quarter. We also recently announced our third construction materials acquisition of the year, and we continue to evaluate additional acquisition opportunities at both construction businesses.”2
CONSTRUCTION MATERIALS UPDATE
Construction input prices increased 0.8 percent in June and are up 9.6 percent on a year-over-year basis, according to an Associated Builders and Contractors (ABC) analysis of data recently released by the U.S. Bureau of Labor Statistics.

AGGREGATES MATERIALS
Industry results in Q2 2018 showed increases in volume compared to the same period in 2017 for cement (4.3 percent), crushed stone (8.0 percent), and sand and gravel (6.4 percent). Additionally, ready-mix concrete and asphalt both experienced increases in prices when compared to the prior year period.
 Cement4
- Portland cement consumption (23.6 million metric tons) increased by 4.3 percent in Q2 2018 compared to Q2 2017.
- The average net selling price per ton for Martin Marietta and Eagle Materials in Q2 was $108.90, an increase of 0.9 percent over the prior quarter and a 2.1 percent increase over the same period in 2017.
Source: US Geological Survey
 Ready-Mix Concrete (RMC)
- RMC prices decreased 1.2 percent in Q2 2018 and were up 1.5 percent when compared to Q2 2017. Price data is computed from the average RMC net selling prices of U.S. Concrete, Vulcan Materials, Martin Marietta and Eagle Materials.
- Ready-mix concrete volume is not tracked on a quarterly basis.
Sources: NRMCA Industry Data Survey, Average RMC selling price of U.S. Concrete, Vulcan Materials, Martin Marietta Materials & Eagle Materials
 Crushed Stone4
- An estimated 393 million metric tons of crushed stone was produced and shipped for consumption in the US in Q2 2018.
- Crushed stone production in Q2 2018 increased 8.0 percent compared to Q2 2017.
- Pricing data specific to crushed stone production is not available on a quarterly basis.
Source: U.S. Geological Survey
 Sand & Gravel4
- Sand & gravel production in Q2 2018 increased 6.4 percent compared to Q2 2017, the fourth consecutive quarterly increase when compared to the same period the prior year.
- Pricing data specific to sand & gravel production is not available on a quarterly basis.
Source: U.S. Geological Survey
 Asphalt
- Asphalt prices increased 3.4 percent in Q2 2018 as measured by the average net asphalt selling prices of Vulcan Materials and Martin Marietta. Asphalt prices increased 4.2 percent when compared to Q2 2017.
- Asphalt volume is not tracked on a quarterly basis.
Sources: EAPA Asphalt in Figures, NAPA, Vulcan Materials & Martin Marietta Materials average of net asphalt selling prices
Citations
- Vulcan Announces Second Quarter 2018 Results, https://ir.vulcanmaterials.com/investor-relations/news-releases/news-details/2018/Vulcan-Announces-Second-Quarter-2018-Results/default.aspx, accessed August 13, 2018.
- MDU Resources Reports Second Quarter Earnings, Reaffirms 2018 Guidance, https://www.mdu.com/news/2018/07/31/mdu-resources-reports-second-quarter-earnings-reaffirms-2018-guidance, accessed August 13, 2018.
- US Silica, “U.S. Silica Completes Acquisition of EP Minerals,” https://ussilica.gcs-web.com/news-releases/news-release-details/us-silica-completes-acquisition-ep-minerals, accessed August 10, 2018.
- US Geological Survey, https://www.usgs.gov/, accessed September 27, 2018
Capstone Headwaters is an elite investment banking firm dedicated to serving the corporate finance needs of middle market business owners, investors and creditors. Capstone Headwaters provides merger & acquisition, private placement, corporate restructuring and financial advisory services across 16 industry verticals to meet the lifecycle needs of emerging enterprises. Headquartered in Boston and Denver, Capstone Headwaters has 20 offices in the United States, United Kingdom and Brazil with a global reach that includes more than 300 professionals in 34 countries. For more information, visit www.capstoneheadwaters.com. To discuss any information contained in this report, contact the Capstone Headwaters team: Darin Good, managing director, [email protected], 303-549-5674; Brian Krehbiel, senior vice president, [email protected], 970-215-9572.