
It Is A Good Time To Try And Find Profit-Oriented Railroad Executives Who Will Consider Using Aggregates Trains.
By Mitch Albert
Here are some facts in the marketplace today:
- Aggregates producers that ask railroads for shipping rates for less than 200 miles are often ignored or chased away with onerous rates after six months.
- Railroad aggregate shipments have been steady and are meagerly increasing to around 9% of the industry’s approximately 2.47 billion tpy so there are successes but below their potential.
- The railroads often take more than several months to approve engineering designs and practical freight rates.
- Can we identify a successful process so that 100 to 200-mile aggregate shipments would be perhaps “gold” to the railroads, just like coal but with rates under $0.06/ton mile for the shipper?
Just like the aggregates business, railroads are everywhere and always run through main aggregate-demand population centers. There are 140,000 track miles with seven big Class 1 railroads (colored); 22 regionals; and 584 shortlines (black lines), according to federal sources. Most aggregates demand is in the Census Department “Urban” areas (less than 3% of the land). Railroads run through 97% of the “Rural” lands of diverse geology with much of the land near tracks (see Map below).
In the past, quarries were located closer to populations to minimize trucking costs, accepting more work from zoning, county special-use permits and air-reclamation-water permits. Depletion and growth point to new aggregate sources further away. Combined with trucking costs likely to be more than 2-5 times of the noted railroad rate, distant railroad sites could be attractive for market share and increased profits.
In the 1960s, shippers and railroads, aided by coal pipelines for the billion-tpy coal industry, developed REAL coal unit trains. The REAL unit train is nonstop loading-delivery-unloading, a single commodity with enough cars to justify a dedicated train synchronized with engine horsepower that never enters a railroad yard over an average 900 miles. Rates dropped (see Graph below).
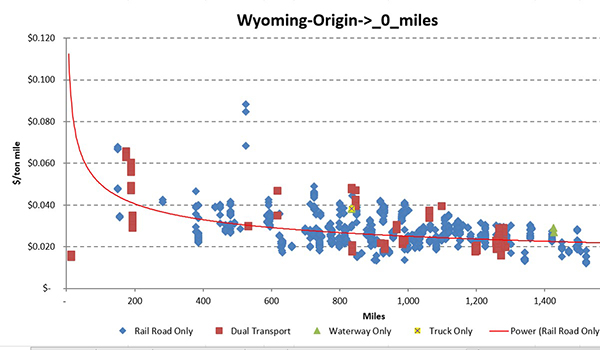
The weighted average documented rate including the fuel surcharge for coal to utilities in 2018 was $0.0185/ton mile (10 years ago rates were $0.012/ton mile.) Aggregate shippers will never see such rates.
Downtown Los Angeles truck rates suggest $0.40/ton mile with perhaps regional rates $0.15-0.25/ton. “Adjust” any railroad rate up to reflect re-handle and re-trucking operating and capital costs from the rail destination. Perhaps “cookie cutter” aggregates project engineering and REAL unit train operations can be agreed upon for $0.035-$0.060/ton mile including the fuel surcharge rates before even looking for a project. This would avoid the frustratingly humiliating 6- to 12-month typical railroad process.
My first job, in the 1980s, was to coordinate the purchase, quality control and distribution of 6.5 million tpy of ballast from 20 quarries for BNSF over 30,000 miles of track with 4,600 cars. The company required all deliveries to use “real free cash costs” to measure-reduce average ballast costs based on quarry locations and miles traveled, pit loaded prices and rock quality-hardness to reduce more frequent worn out rock replacements over 20 years.
Using this methodology, we can estimate railroad rate real cash costs corroborated with their reported numbers. This strategy is onerous in learning, including convincing the railroad that you are not the typical shipper who says one thing and then does not perform. The railroad rightfully guards against this risk by raising rates instead of trusting shipper promised operating performance. Just having 100 cars to ship more than likely will elicit even higher rates.
Today is a good time to try and find profit-oriented (as opposed to revenue-oriented) railroad executives to perhaps structure a “package” to guarantee the railroad the same annual net income that they now get from the disappearing coal trains using new aggregates trains.
Railroads do not rely much on new customers as much as higher initial rates, double dipping fuel surcharges and fixed unreasonable escalators. This latter strategy pleases Wall Street, maintaining higher financial growth but not physical volume.
Railroad car shipping volume is falling, but much of it structural, not recession-related or due to the coronavirus. Permanent long-term structural declines include:
- Coal.
- Wisconsin, Minnesota and Illinois frac sands displaced by cheaper regional sand mines in areas such as Texas.
- Oil displaced by recession and finished pipelines.
Sixteen of the 20 railroad shipping categories (88% of their volume) are showing negative growth rates. If trade patterns change, then intermodal will also remain depressed.
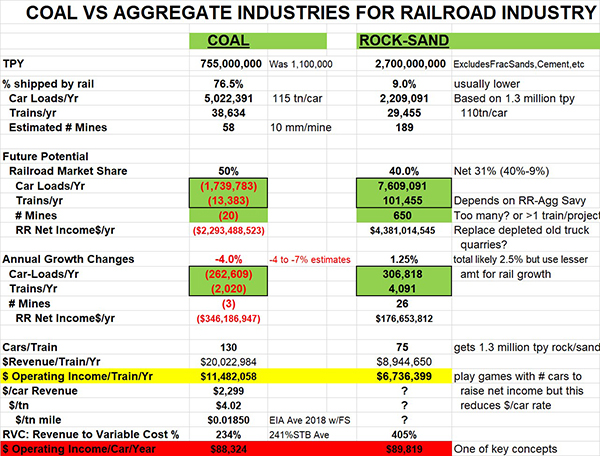
There are maybe 5,000 locomotives and greater than 300,000 cars in storage doing no business. Table 1 highlights coal’s permanent lost railroad business and how the aggregate business can replace car volumes and net income in total and by net income/car/year.
Unit Trains
The unit trains love long distances so aggregate going only 100-200 miles are often ignored perhaps due to a likely but incorrect conclusion of lower net income per shipment. What railroad operations can help maintain the net income per car of aggregates at the same level as coal?
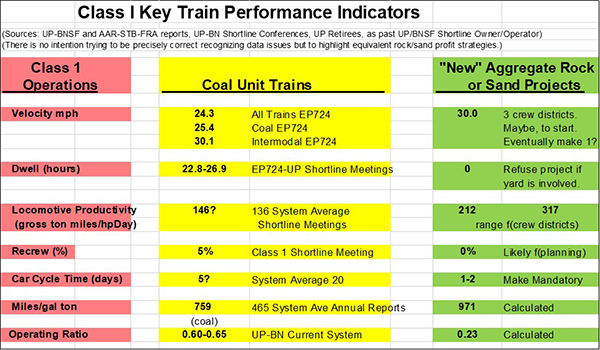
The shipper knows his customer’s delivered price to subtract pit price and transport to get their net income-EBITDA. While the railroad marketing department prevents the shipper from talking to operating people, the shipper needs to know they meet or exceed the railroad’s average operations shown in Table 2.
One key is capital asset “Car Cycle Time.” The railroad’s net income from aggregates can come from three directions:
- Reduced cost only from REAL unit trains.
- An appropriate rate markup of variable costs only from REAL unit train.
- Operating plans making the train turn many more times than a coal train.
The $/car, $/tn and $/tn mile have a “?” in Table 1 but these rates are mentioned in the text. The reader can also back calculate. This is intentionally vague to reduce expectations that are usually inappropriate.
The railroad has been frequently burned by shippers promising to run operations a certain way when most of them do not understand their commitment and/or will not perform as the railroad expects. Railroads protect themselves with higher rates and shoving the shipper into slower regular merchandise trains.
Maybe consider the often-unattainable REAL unit train as a special case of so called “precision scheduled railroading (PSR)” lecture given to all shippers. The latter will reduce tpy, raise the number of of cars required and car cost, and decrease shipper’s scheduling ability. Often many projects should stay with the PSR merchandise train’s cars absorbing the additional time and costs, as it is much easier to conclude with railroads.
A key variable is whether the origin and destination are “captive,” meaning monopoly to the railroad, or they are “open” to a second railroad with ownership or trackage rights.
If such foresight is exploited and available to shipper and geologist, this forces two railroads to compete for your business. Time and rates are reduced. Captive or monopoly track locations are 50% to 100% across states but average 85% nationwide. Concluding rates and results are based on this distinction. There are many locations “open” or “competitive” allowing competing rates from more than one railroad.
Track data is based on “primary” track ownership and is NOT based on track agreements allowing a second railroad to pick up and deliver cars on the original railroad. This knowledge is not disclosed and often “unknown.”
Location is critical. As a geologist, include “open” track locations with distances and geology. Since track is “cheap,” expand exploration two to three miles from track. (Building track raises other advantageous federal options aiding rate negotiations usually unknown and only exploited by the larger companies.) Or, a “whipsaw” approach can be used by controlling two destination terminals and two quarry sites (nothing built) until one of the railroads offers the desired rate.
The revenue-to-variable-cost operating ratio shows that aggregates rates need to be higher than the comparable coal rate. Coal may be around 234% but to replace net income, the aggregates cars may be around 405% of variable costs but only if using REAL unit trains.
Even if the shipper pays 600-700% of the revenue to variable cost ratio, this could well be great. The critical issue is making sure that the variable costs are based on a real unit train variable costs. Otherwise the freight rate will be onerous if not a rip off. As some reference per the Surface Transportation Board (STB), 44% of all shipments are less than 150%, 15% are 150-240% and 41% are greater than 240% of average variable operating cost. So, yes, 600-700% is not really good but competent project planning can get 400% which would be great for aggregates and great for the railroad.
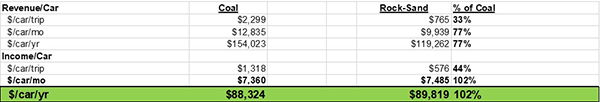
The railroad marketing department’s $/car revenue focus will make this strategy fail. Watch how the numbers change from a railroad “marketing” revenue perspective low-valued aggregate car ($/car/trip) to how the same aggregate car is as valuable in net income per year as the coal car (the last row) in Table 3.
Fuel surcharges are attached to rates but are essentially railroad profit centers and not railroad fuel-cost increase protection. Railroads collect hundreds of millions of dollars unrelated to fuel costs per annual/quarterly data from the STB.
Union Pacific in 2018 spent $639 million on fuel costs, mostly embedded, covered in existing freight rates. Their fuel bill dropped $19 million but the company charged customers $488 million in fuel surcharges.
Railroad formulae for strike price and fuel escalation have little to do with a railroad’s fuel cost and changes. Review their formulae and mandatory reported STB data. Negotiations are unlikely even with a simple solution to make the strike price the current price and escalating fuel charges based on some percentage of rate fuel cost (2018: 15.9% of cost not rate) times the change in fuel price up and down. The STB essentially refuses to address the issue.
Railroads contractually escalate their rates typically at 3% per year even when their costs drop. Efficiency and cost reduction gains are not shared with shippers. An operating ratio is the ratio of a railroads operating cost to revenue. This has been steadily dropping from 0.80 to now around 0.60. Then, what does the fixed escalator cover? This dropping ratio supports the likely negative growth in actual real cost. Further, productivity adjusted costs often show greater negative cost changes.
The fuel surcharge is “sacred” making it “ignored” requiring the shipper to ONLY add it to any rate for project planning. The escalator will not apply to the fuel surcharge component. Escalation may go to more than 3% due to reduced inflation but they always insist on something whether logical and reasonable or not emphasizing, then, a lower initial freight rate.
Another bogus rate argument is how the STB and railroads calculate their “revenue adequacy rate of return.” (Several publications show that Warren Buffet never accepted such formulae or return numbers from buying BNSF.) This is another “sacred cow” that can’t really be explained-justified to shippers with real current logical line items adding up to the denominator in this calculation.
Just like buying-leasing trucks, rail projects need to buy-lease cars. Aggregate shippers often buy $125,000 cars 45-ft. long instead of old 53-ft. coal cars to reduce needed track and with steep slopes to avoid car shaking.
Building track or using an overhead car shaker 30 seconds/car are cheap by comparison allowing use of cheaper 53-ft. cars. One urban terminal with a car shaker and old coal cars unloaded at 2,000 tph and cost not much less than $1 million including land. Small, mid-sized companies can compete with the big-name companies spending tens of millions of dollars.
Conclusion
Will a shipper get the rates suggested in a timely manner? Not likely. Some of the reasons are good and some are bad but hopefully this should allow far more aggregate projects to be considered and implemented by both railroads and aggregate shippers at some “intermediate” reasonable time with profitable freight rates for shipper and railroad.
What if a railroad would guarantee “reasonable” terminal track engineering requirements and define freight rates in exchange for essentially a “take or pay” agreement for the aggregate company to go out and accelerate development of multiple new sites? Yes, don’t faint over “greenfields” because you’ll be working with rural land locations typically with no county zoning or special use permits, no nearby neighborhoods with million-dollar homes, and state air, reclamation and water permits surprisingly inexpensive and not time consuming.
Mitch Albert, DCR Inc., Denver, has a PhD in mineral economics, is the past owner of Quarry and Rock & Rail 51 mile shortline, is a Certified Mineral Appraiser and Professional Geologist. He can be reached at 303-741-2556.