
Aggregates Prices Rise In The United States By 1.5% In The First Quarter Of 2023.
By Barry Hudson
This is the fifth in a series of articles on pricing. -Ed.
The 1.5% rise in the average price of aggregates in the first quarter of 2023 comes after a higher price rise (4.7% in the fourth quarter of 2022). The price movements, as measured by the Aggregates Producer Price Index (APPI) allows aggregates consumers and producers to track the trends in pricing of various aggregate categories across the United States.
The APPI provides a clear indication of the degree of price movement experienced by each product category in the period being measured, which allows for a deeper understanding or a solid foundation from which to start a detailed price analysis.
The APPI tracks four product categories: Premium sand, concrete coarse aggregate, asphalt coarse aggregate and Type 1 Base or equivalent. The APPI further breaks down product categories by four general geologies: limestone, natural sand and gravel, granite and hard rock.
Do You Want to Know Your Local Aggregates Pricing?
To assist in making the APPI more relevant, we are offering to any company or production site that will share with us their current aggregates list prices, the up-to-date State APPI for that particular site.
The State APPI will consist of two letter indexes. The first letter represents where a certain product sits nationwide in relation to similar products pricewise. The second letter represents the relative price movement of that product.
Please email [email protected] or follow this link to submit your current price list information.
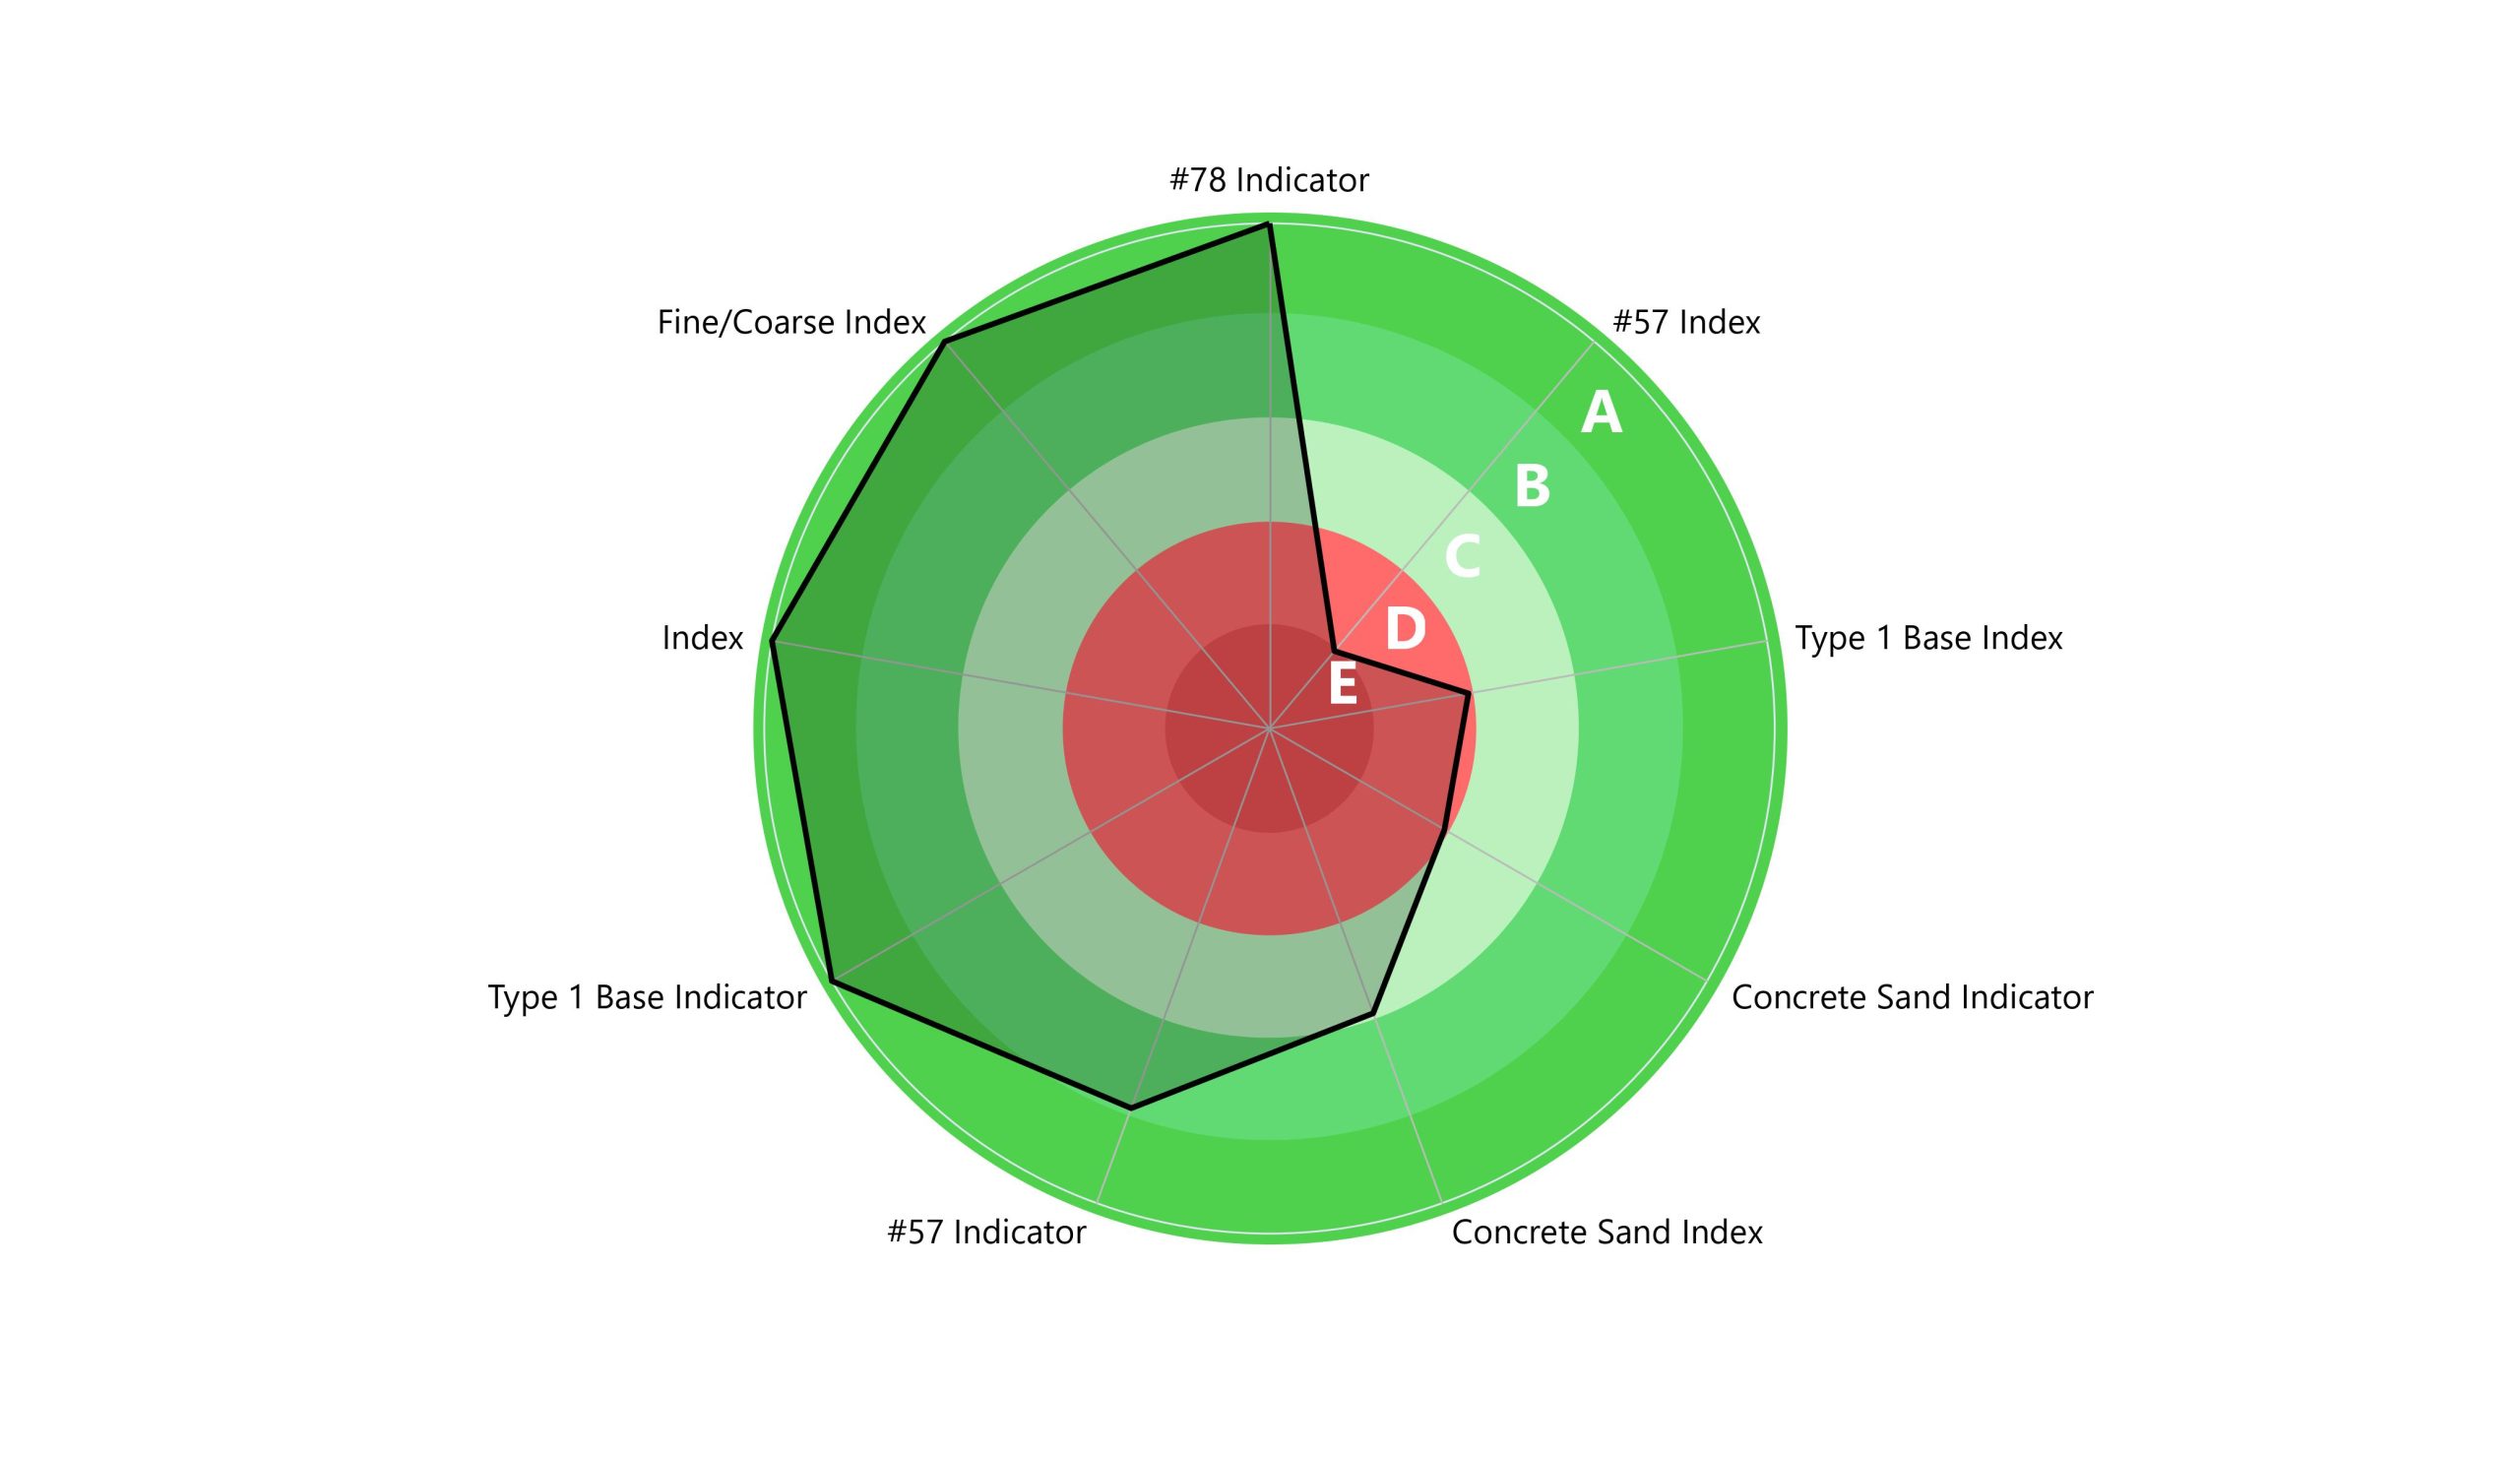
After submitting the survey above you will receive the data for your state for four products and indicator that shows where the price is situated nationally. The example for Oklahoma is below.
Spider graph below shows that Oklahoma had one of the lowest price growth on the market for 57s with E rating, but the price for 57s was relatively high for this state. Same situation with Type 1 Base, index value was relatively low among the states with D-rating, but prices are high. Concrete sand index is quite high for this state, which gives him top position in overall rating.
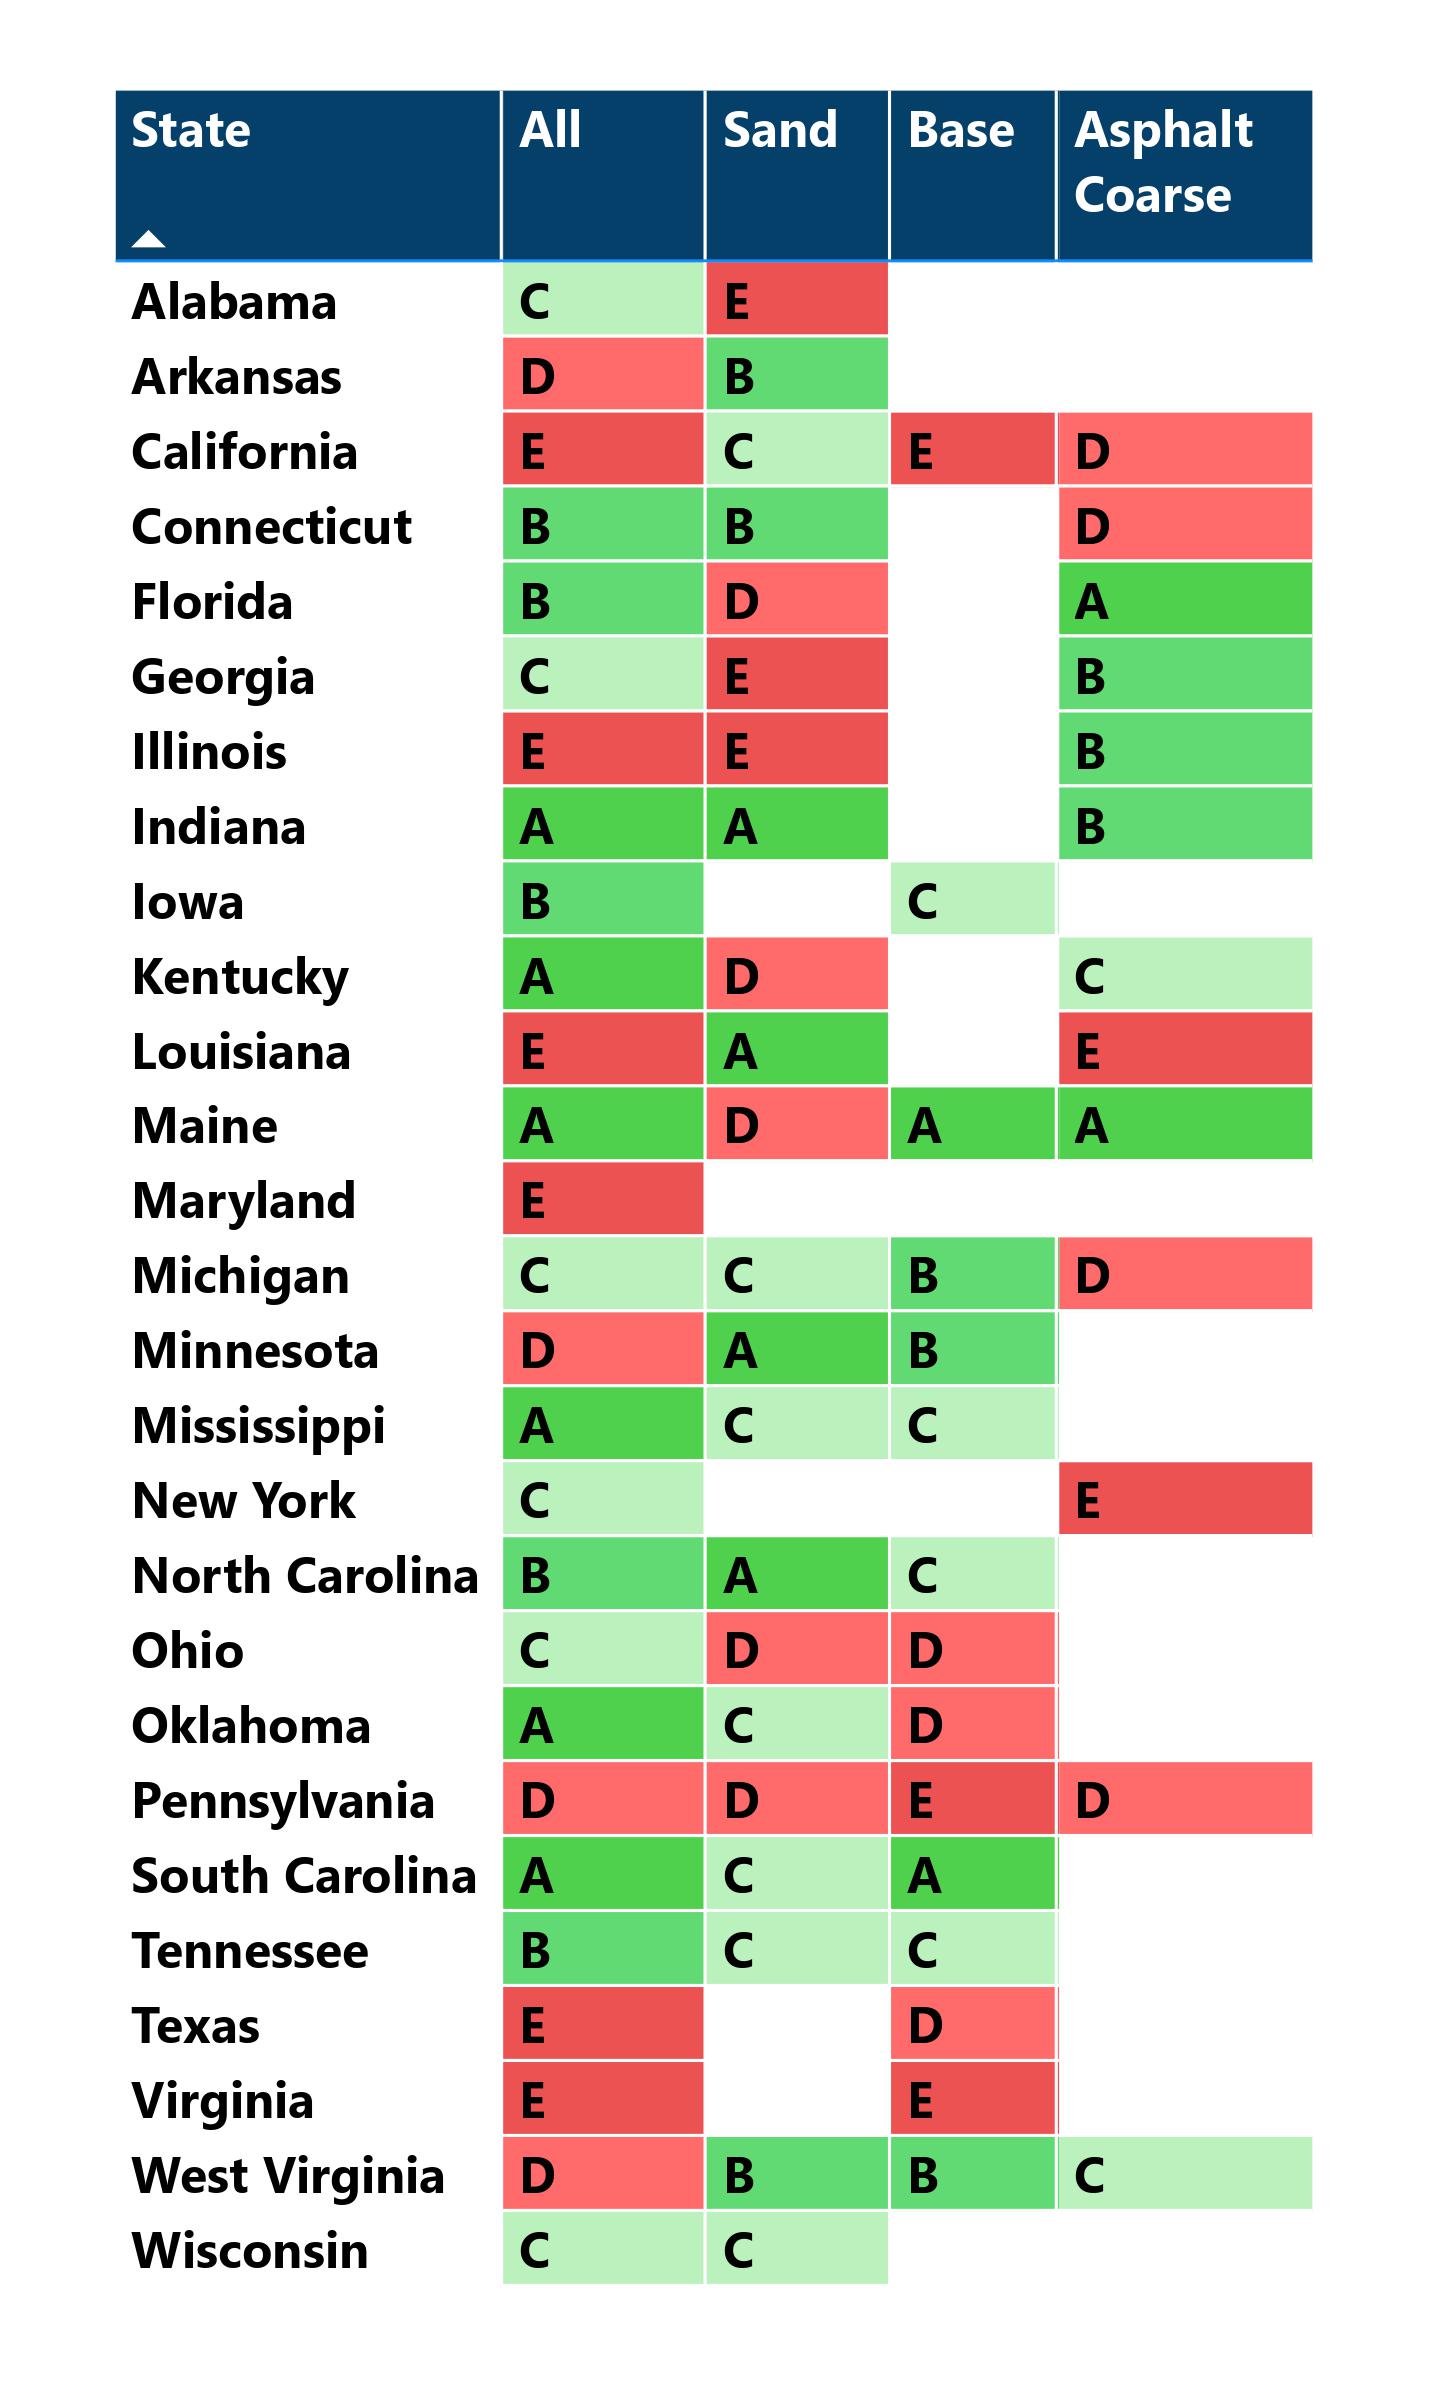
The table shows ranking of A-E that represents the degree of price movement experienced by that product category in the financial quarter being measured for each state. A being positive, and E being negative price movement
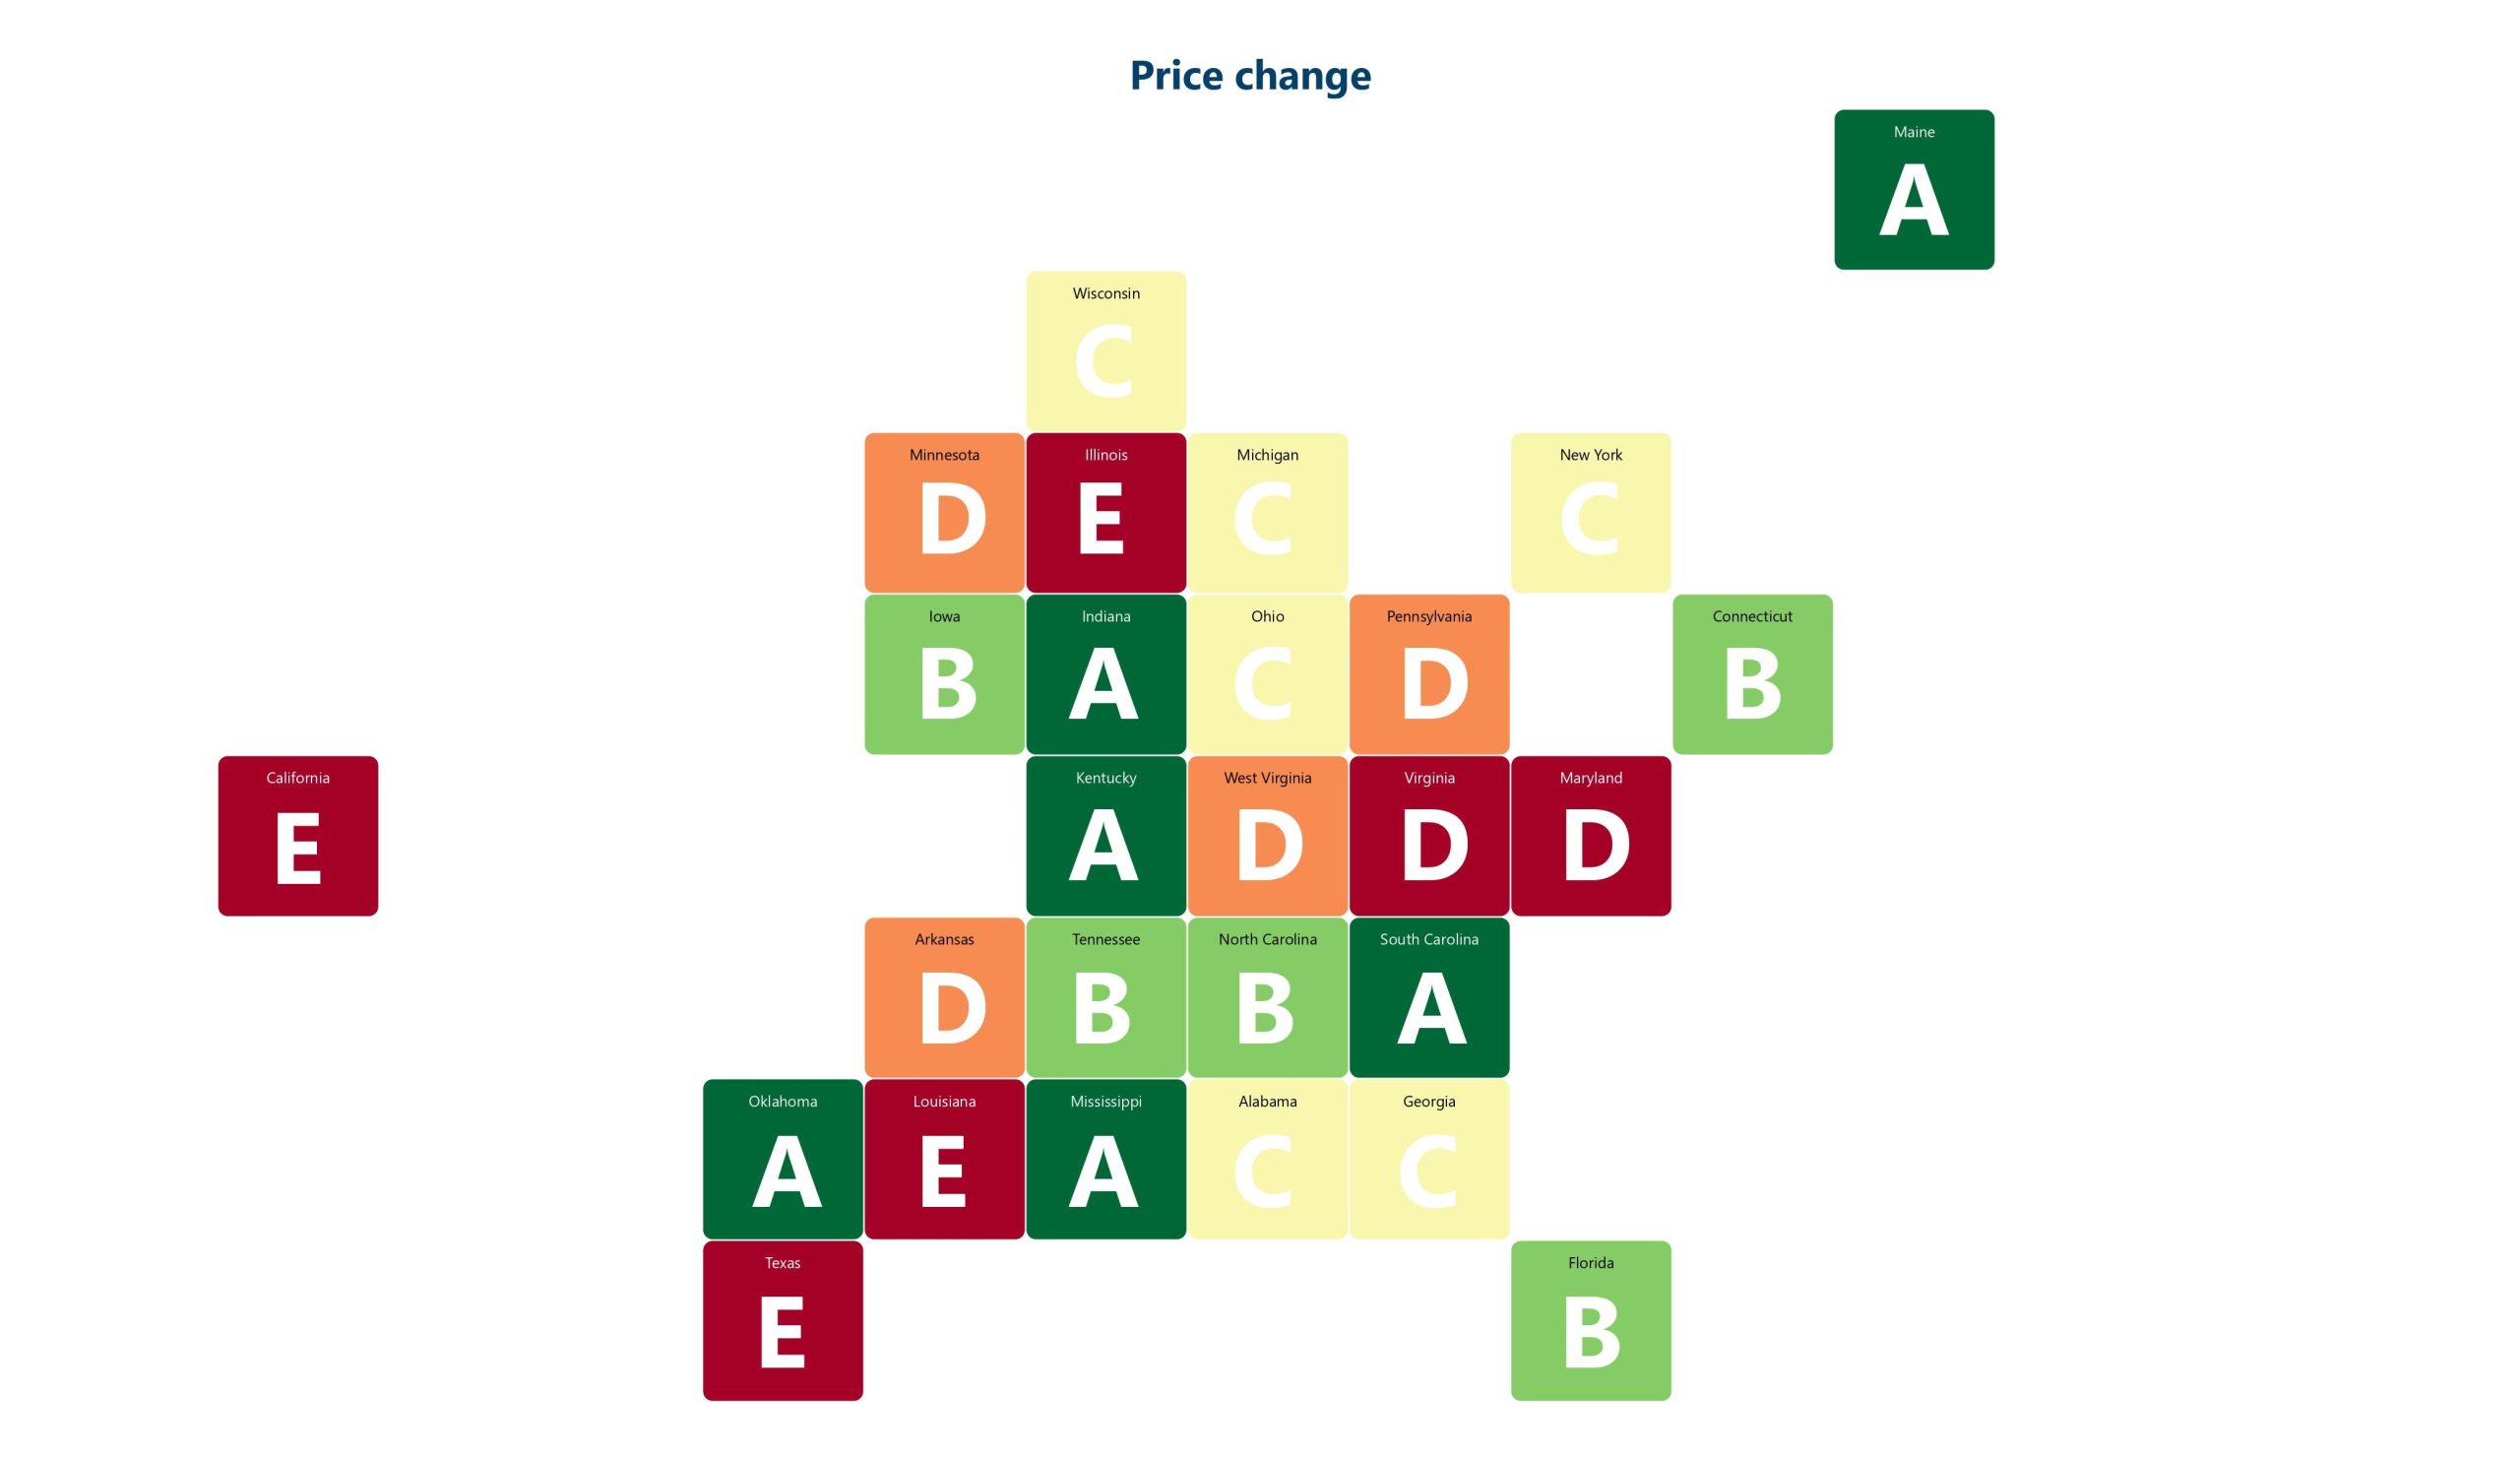
Another representation of index is a map that shows A-E ranking, where A is a maximum price change and E is the lowest change among all states.
The latest APPI indicates that the overall index change between the fourth quarter of 2022 and the first quarter of 2023 was a positive 1.56%. This increase includes the smaller companies’ annual price increases on Jan. 1 and larger companies continuing to move their pricing as per 2022. However, the data in the APPI clearly shows price increases are not uniform, with some aggregates markets products seeing price erosion in some states.
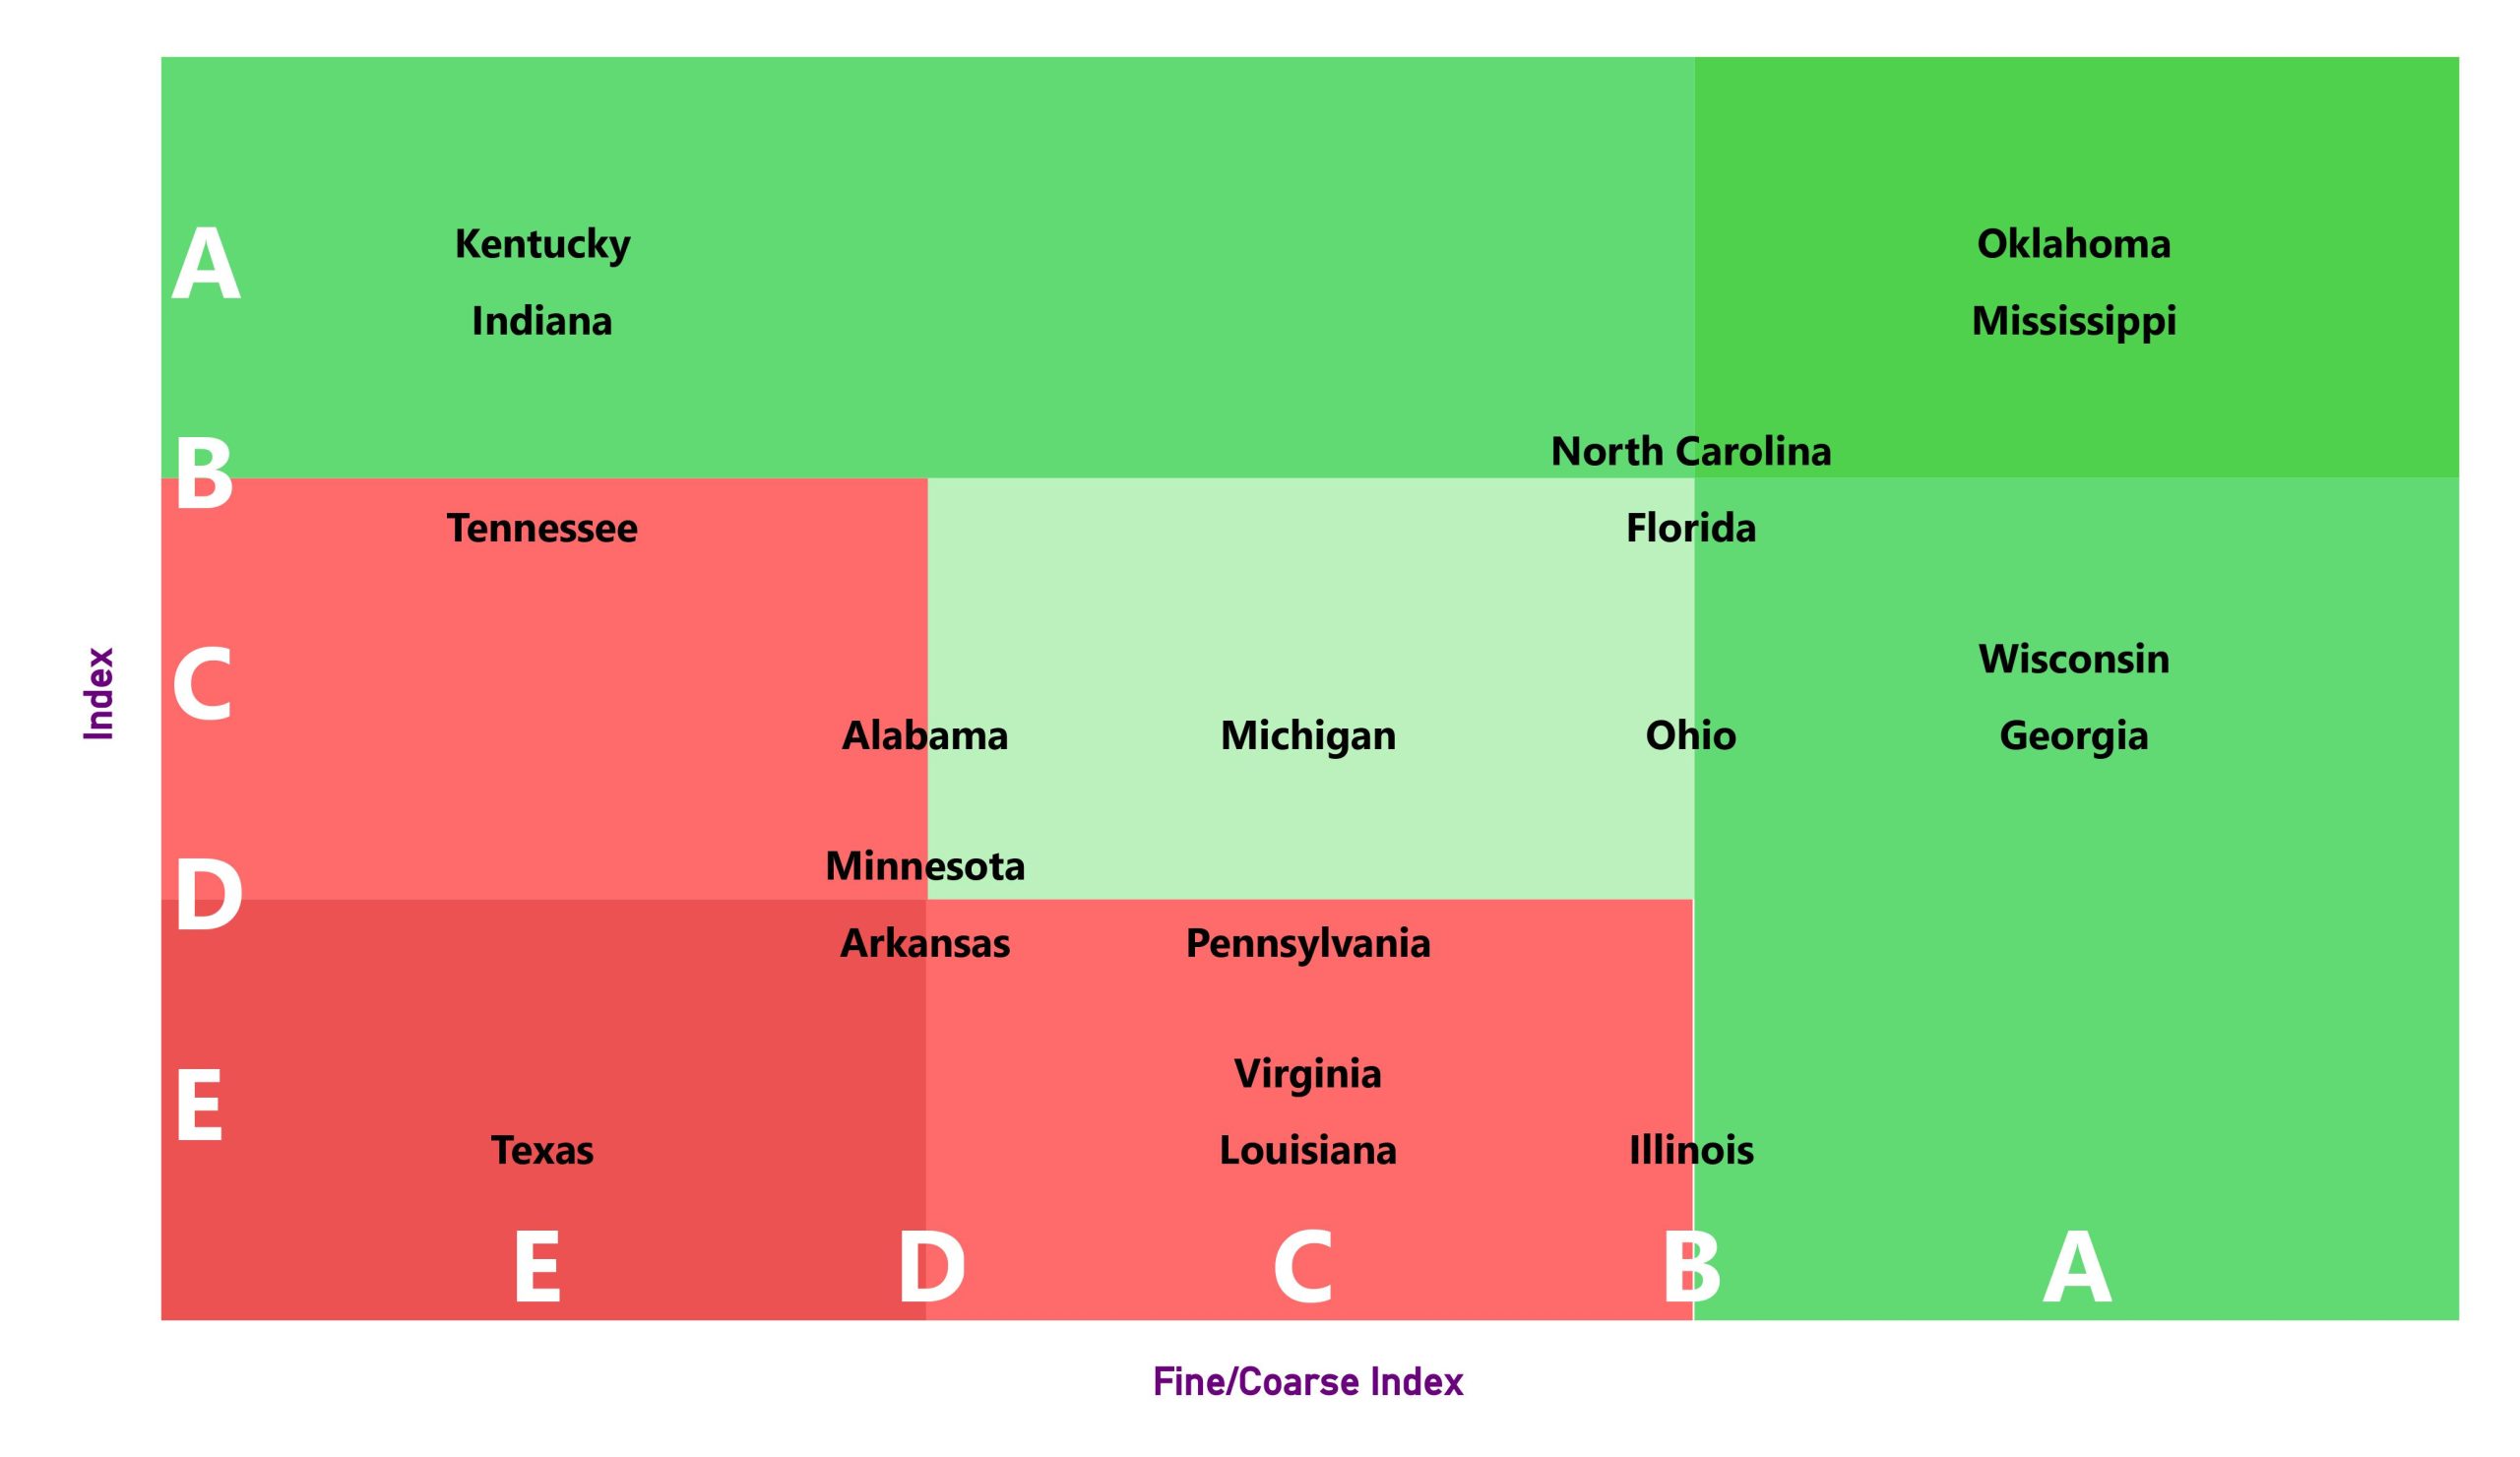
The graph below represents an index to fine/coarse index matrix. Fine aggregates are defined as being smaller than 5 mm in size. In the graph, the Y-axis shows the index growth where A is the maximum growth and E is the lowest. X-axis shows the rate of change between fine and coarse material prices where A is the maximum growth of fine materials price against coarse and E is minimum of this rate.
The matrix shows that Oklahoma is in upper right quadrant showing maximum price change growth among all other states. At the same time this state got maximum increase in fine price over coarse which basically tell us where the overall growth comes from. At the same time Texas is having the lowest price change in both indicators occupying the lower left quadrant.
Looking at the breakdown of the price change by several aggregate categories and geologies allows us to better understand overall pricing in a given market. For example, in the first quarter of 2023, the highest percentage increase in aggregates pricing was in Oklahoma, with some prices rising over a staggering 25% in that period. In the same way, this region has broken records with its surge in the prices of coarse materials compared to the modest growth in prices of fine materials. This is evidenced by the fact that the price of sand has risen by only half as much as the price of coarse materials.
The smallest aggregate price change for the first quarter 2023 was in California. Florida saw a one-third of Oklahoma’s increase in prices, while Alabama experienced the lowest increase among all mentioned states. North Carolina performed a little better with higher increases in prices than Florida. Kentucky saw a twice increase in prices from Alabama. Detailed information on these price movements are available at www.mineralocity.com.
An intriguing state is Indiana, which ranks second lowest among states in terms of the rate of change between fine and coarse material prices. Here, the price of sand materials has increased by almost a quarter more than that of coarse materials. Despite this, Indiana ranks second among states in terms of index growth.
One state that has remained almost flat in terms of price changes is Texas. Remembering that the APPI is a Producers Index, any price movement attributed to any aggregates imports is not included in the index. Texas is in the middle of the range in terms of price position, which is interesting due to the stability of market sales and constant demand.
Upon closer examination of the composition of materials produced in the state, it becomes apparent that this metric is attained through a reduction in the price of fine materials and a corresponding increase in the price of coarse materials. This has resulted in an almost 20% difference in the rate of change between these two types of materials.
To see full information on all states available, please go to Mineralocity.com. Also we are reminding you, that you can contribute to APPI development as Chris Summers of Burgex Inc., the creators of Mineralocity Aggregates (the platform that exclusively hosts the APPI), is offering a free State APPI to any company that agrees to supply quarterly updates, just go here to complete a survey on your current aggregates list prices. No pricing data submitted to the APPI will be made public or shared with third parties, and all pricing reported will follow the two-letter format detailed above.
Barry Hudson is with Price Bee, www.price-bee.com.