
USGS Reports Recent Increases in Crushed Stone, Sand and Gravel Production.
The estimated U.S. output of construction aggregates produced and shipped for consumption in the first quarter of 2019 was 449 million metric tons (Mt), an increase of 9% compared with that of the same period of 2018, according to Jason Willett, crushed stone commodity specialist for the U.S. Geological Survey (USGS).
An estimated 281 Mt of crushed stone was produced and shipped for consumption in the United States in the first quarter of 2019, an increase of 13% compared with that of the same period of 2018.
The estimated U.S. output of construction sand and gravel produced and shipped for consumption in the first quarter of 2019 was 168 Mt, an increase of 3% compared with that of the same period of 2018.
Shipments of portland and blended cement increased slightly in the first quarter of 2019 compared with the first quarter of 2018. This information was obtained from the USGS monthly survey of U.S. cement producers.
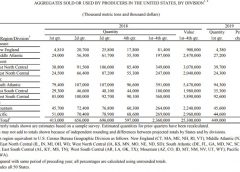
The estimated production-for-consumption of construction aggregates in the first quarter of 2019 increased in five of the nine geographic divisions compared with that sold or used in the first quarter of 2018. Production-for-consumption increased in 25 of the 39 states that were estimated.
The five leading states were, in descending order of production-for-consumption, Texas, Florida, California, North Carolina and Arizona. Their combined total production-for-consumption was 155 Mt and increased by 4% when compared with that of the same period of 2018.
The estimated production-for-consumption of crushed stone in the first quarter of 2019 increased in six of the nine geographic divisions compared with that sold or used in the first quarter of 2018. Production-for-consumption increased in 28 of the 45 states for which estimates were made.
The five leading states were, in descending order of production-for-consumption, Texas, Florida, North Carolina, Georgia and Pennsylvania.
The estimated production-for-consumption of construction sand and gravel in the first quarter of 2019 increased from that of first quarter 2018 in five of the nine geographic divisions. Production-for-consumption increased in 22 of the 42 states for which estimates were made.
The five leading states were, in descending order of production-for-consumption, Texas, California, Arizona, Washington and Florida.
2018 Production
An estimated 599 Mt of total construction aggregates was produced and shipped for consumption in the fourth quarter of 2018, an increase of 5% compared with that of the same period of 2017, according to Willett.
“The estimated annual output of construction aggregates produced for consumption in 2018 was 2.37 billion Gt, an increase of 5% compared with that of 2017,” Willett said.
An estimated 359 Mt of crushed stone was produced and shipped for consumption in the fourth quarter of 2018, an increase of 5% compared with that of the same period of 2017.
The estimated annual output of crushed stone produced for consumption in 2018 was 1.41 Gt, an increase of 4% compared with that of 2017.
The estimated output of construction sand and gravel produced and shipped for consumption in the fourth quarter of 2018 was 241 Mt, an increase of 4% compared with that of the same period of 2017.
The estimated annual output of construction sand and gravel produced for consumption in 2018 was 961 Mt, an increase of 7% compared with that of 2017.
The above estimates are based on information reported to the USGS quarterly sample survey of construction aggregates producers in the United States.
Shipments of portland and blended cement increased by 2% in the fourth quarter of 2018 compared with the fourth quarter of 2017. Annual consumption increased by 3% in 2018, compared with that of 2017. This information is obtained from the USGS monthly survey of U.S. cement producers.
The estimated production for consumption of construction aggregates in the fourth quarter of 2018 increased in seven of the nine geographic divisions compared with that sold or used in the fourth quarter of 2017. In the fourth quarter, production for consumption increased in 17 of the 40 states for which production estimates of construction aggregates were made.
The five leading states in the fourth quarter of 2018 were, in descending order of production, Texas, California, Pennsylvania, Ohio and Florida. Their combined total production for consumption was 182 Mt (30% of the U.S. total).
The estimated total annual production for consumption of construction aggregates in 2018 increased, compared with that in 2017, in 34 of the 50 states for which estimates were made. The five leading states were, in descending order of total annual output for 2018, Texas, California, Florida, Pennsylvania and Ohio. Their combined total annual output was 716 Mt, an increase of 7% when compared with that of 2017.
The estimated production for consumption of crushed stone in the fourth quarter of 2018 increased in seven of the nine geographic divisions compared with that sold or used in the fourth quarter of 2017. Production for consumption increased in 25 of the 45 states for which production estimates of crushed stone were made.
The estimated production for consumption of construction sand and gravel in the fourth quarter of 2018 increased from fourth quarter 2017 levels in eight of the nine geographic divisions. Production for consumption increased in 21 of the 42 states for which production estimates of construction sand and gravel were made.
Methodology
The quarterly sample survey generates production-for-consumption estimates by quarters, based on information reported voluntarily by a limited number of producing companies.
In most quarters, a few companies may report amounts sold in the current quarter that differ greatly from the amounts reported in the previous year during the same quarter. This change in sales is almost never an indicator of the change in the demand in the state as a whole.
The reason for a large change can be the opening or closing of an operation, weather or an external force that only the company or one of its operations experienced in that quarter.
Previously reported data are occasionally revised, and the estimated quantities for the prior quarters are then recalculated. The latest release of the quarterly Mineral Industry Surveys contains the most recent estimated totals and supersedes previously published reports
The Rock Products Market Composite
Each year, the USGS releases its Mineral Commodity Summaries report. Published on an annual basis, this report provides industry data for more than 90 individual minerals and materials.
For the Rock Products Market Composite, we took data from six commodity segments – crushed stone, construction sand and gravel, industrial sand, cement, lime and gypsum – and combined it to calculate a market tonnage total.
For 2018, the Rock Products Market Composite is 2.616 billion tons of material produced. That is compared to 2.448 billion tons of material produced in 2017, an approximate 6% increase.
Here is market data by commodity segment:
Crushed Stone – In 2018, 1.41 billion tons of crushed stone valued at more than $16.6 billion was produced by an estimated 1,465 companies operating 3,710 quarries and 176 sales and (or) distribution yards in 50 states, an increase of 4% compared with 2017.
Leading states were, in descending order of production, Texas, Pennsylvania, Florida, North Carolina, Ohio, Missouri, Georgia, Virginia, Tennessee and Illinois, which together accounted for more than one-half of the total crushed stone output.
Of the total domestic crushed stone produced in 2018, about 68% was limestone and dolomite; 15%, granite; 6%, traprock; 5%, miscellaneous stone; 4%, sandstone and quartzite; and the remaining 2% was divided, in descending order of tonnage, among marble, volcanic cinder and scoria, calcareous marl, slate, and shell.
It is estimated that of the 1.5 billion tons of crushed stone consumed in the United States in 2018, 75% was used as construction material, mostly for road construction and maintenance; 13% for cement manufacturing; 7% for lime manufacturing; 3% for other chemical, special, and miscellaneous uses and products; and 2% for agricultural uses.
Construction Sand and Gravel – Construction sand and gravel production was about 961 million tons in 2018, an increase of 7% compared with that of 2017. Demand for construction sand and gravel increased in 2018 because of growth in the private and public construction markets, especially after this segment being flat during the past two years. Commercial and heavy-industrial construction activity, infrastructure funding, new single-family housing unit starts, and weather affect growth in sand and gravel production and consumption.
Long-term increases in construction aggregates demand will be influenced by activity in the public and private construction sectors, as well as by construction work related to security measures being implemented around the nation. The underlying factors that would support a rise in prices of construction sand and gravel are expected to be present in 2019, especially in and near metropolitan areas
Industrial Sand and Gravel – In 2018, industrial sand and gravel production was 120 million tons, valued at about $6.2 billion, produced by about 191 companies from 321 operations in 35 states.
The value of production of industrial sand and gravel in 2018 increased by 22% compared with that of the previous year, and by 130% compared with 2016, owing primarily to increased demand for hydraulic-fracturing sand for the oil and gas sector. Leading states were Wisconsin, Texas, Illinois, Missouri, Minnesota, Oklahoma, North Carolina, Mississippi, Iowa and Arkansas, in order of tonnage produced. Combined production from these states accounted for 87% of the domestic total.
About 73% of the U.S. tonnage was used as hydraulic-fracturing sand and well-packing and cementing sand; as glassmaking sand and other whole-grain silica, 7% each; as foundry sand, 4%; as other ground silica, and whole-grain fillers and building products, 2% each; as ground and unground sand for chemicals, filtration sand, and recreational sand, 1% each; and for other uses, 2%.
Cement – Production of portland cement in 2018 in the United States increased slightly to about 85.4 million tons, and output of masonry cement continued to be stagnant at 2.4 million tons. Cement was produced at 98 plants in 34 states, and at two plants in Puerto Rico. Overall U.S. cement production continued to be well below the record level of 99 million tons reported in 2005, indicating continued full-time idle status at a few plants, underutilized capacity at many others, production disruptions from plant upgrades, plant closures over the interim, and relatively inexpensive imports in some recent years.
Sales of cement increased by nearly 3% in 2018. Overall, shipments were 27.8 million tons lower than the record volume set in 2005. The overall value of shipments was nearly $12.7 billion. Most of the sales of cement were to make concrete, worth at least $66 billion.
In recent years, about 70 to 75% of cement sales have been to ready-mixed concrete producers, 8 to 10% to contractors (mainly road paving; much contractor work also involves ready-mixed concrete), about 10% to concrete product manufacturers, and 7 to 10% to other customer types. Texas, California, Missouri, Florida and Alabama were, in descending order of production, the five leading cement-producing states and accounted for nearly 50% of U.S. production.
U.S. Aggregates Production |
 |
Lime – In 2018, an estimated 19 million tons of quicklime and hydrate was produced (excluding independent commercial hydrators), valued at about $2.4 billion. At year-end, 29 companies were producing lime, which included 18 companies with commercial sales and 10 companies that produced lime strictly for internal use (for example, sugar companies).
These companies had 74 primary lime plants (plants operating quicklime kilns) in 28 states and Puerto Rico. Six of these 29 companies operated only hydrating plants in 11 states.
In 2018, the five leading U.S. lime companies produced quicklime or hydrate in 20 states and accounted for 79% of U.S. lime production. Principal producing states were, in alphabetical order, Alabama, Kentucky, Missouri, Ohio and Texas.
Major markets for lime were, in descending order of consumption, steelmaking, chemical and industrial applications (such as the manufacture of fertilizer, glass, paper and pulp, and precipitated calcium carbonate, and in sugar refining), flue gas treatment, construction, water treatment, and nonferrous mining.
Gypsum – In 2018, domestic production of crude gypsum was estimated to be 21 million tons with a value of about $168 million. The leading crude gypsum-producing states were Colorado, Iowa, Kansas, Nevada, Oklahoma and Texas, which together accounted for an estimated 67% of total output.
Overall, 47 companies produced or processed gypsum in the United States at 50 mines in 16 states. The majority of domestic consumption, which totaled approximately 48 million tons, was used by agriculture, cement production, and manufacturers of wallboard and plaster products.
Small quantities of high-purity gypsum, used in a wide range of industrial processes, accounted for the remaining tonnage. At the beginning of 2018, the production capacity of operating wallboard plants in the United States was about 33.4 billion sq. ft. per year. Total wallboard sales were estimated to be 25.5 billion sq. ft.