
In This Exclusive Analysis prepared for Rock Products, Headwaters MB Looks at Current Market Trends Such as Mergers and Acquisitions, Aggregate Production and Pricing.
By Brian Krehbiel
The worldwide aggregates industry is dominated by a handful of large players. The merger of Holcim and Lafarge, completed July 10, 2015, further defined the industry creating a clear-cut leader. Valuation multiples (Figure 1, includes constituents of Headwaters Aggregates Materials Index) are up and continue to grow particularly for U.S. based aggregates producers including Vulcan Materials and Martin Marietta Materials with EBITDA multiples in the 20.0x range. The publicly traded aggregates industry as a whole is trading at an average EBITDA multiple of 12.1x.
| Figure 1: Public Valuation Multiples | ||||||
| All $’s in Millions | EBITDA | Enterprise Value/ | ||||
| Company Name | TEV | Revenue | EBITDA | Margin | Revenue | EBITDA |
| LafargeHolcim Ltd. | 31,001 | 18,830 | 3,633 | 19.3% | 1.65x | 8.2x |
| CRH plc | 22,931 | 19,958 | 1,702 | 8.5% | 1.15x | 13.2x |
| CEMEX, S.A.B. de C.V. | 26,225 | 13,934 | 2,630 | 18.9% | 1.88x | 9.9x |
| HeidelbergCement AG | 19,631 | 13,279 | 2,220 | 16.7% | 1.48x | 8.1x |
| MDU Resources Group Inc. | 5,609 | 4,666 | 859 | 18.4% | 1.20x | 6.5x |
| Vulcan Materials Company | 14,666 | 3,155 | 679 | 21.5% | 4.65x | 21.6x |
| Martin Marietta Materials, Inc. | 12,769 | 3,180 | 708 | 22.3% | 4.02x | 18.0x |
| Buzzi Unicem SpA | 4,038 | 2,570 | 389 | 15.1% | 1.57x | 9.0x |
| Summit Materials, Inc. | 2,150 | 1,288 | 174 | 13.5% | 1.67x | 12.3x |
| Eagle Materials Inc. | 4,571 | 1,085 | 313 | 28.8% | 4.21x | 12.9x |
| Headwaters Incorporated | 1,968 | 869 | 148 | 17.0% | 2.27x | 13.4x |
| U.S. Concrete, Inc. | 1,028 | 793 | 85 | 10.7% | 1.30x | 12.1x |
| Mean | 12,216 | 6,967 | 1,128 | 17.6% | 2.3x | 12.1x |
| Median | 9,189 | 3,167 | 693 | 17.7% | 1.7x | 12.2x |
|
*TEV = Total Enterprise Value (Market Capitalization + Net Debt) Source: Capital IQ |
||||||
Merger & Acquisition Activity
A large portion of the U.S. M&A activity in 2015 related to acquisitions and divestures (Figure 2) associated with regulatory approval of the Holcim/Lafarge merger, which closed on July 10, 2015. Subsequent required divestitures of certain assets have since been completed including transactions with ESSROC Cement Corp. and Continental Cement Company.
| Figure 2: Recent Industry M&A Activity | ||||
| Transaction Date | Target/Issuer | Buyers/Investors | Transaction Value ($mm) | Sellers |
| 08/28/2015 | E&A Materials, Inc., Select Assets & Pitts Sand & Gravel, Inc., Select Assets | U.S. Concrete, Inc. (NasdaqCM:USCR) | Undisclosed | E & A Materials Inc. & Pitts Sand & Gravel, Inc. |
| 08/04/2015 | Martin Marietta Materials, Inc., California Cement Business Assets | CalPortland Company, Inc. | 420.0 | Martin Marietta Materials, Inc. (NYSE:MLM) |
| 08/04/2015 | 3 aggregates facilities and 7 RMC operations in AZ & NM | Vulcan Materials Company (NYSE:VMC) | 21.4 | – |
| 07/24/2015 | Holcim Ltd., Cement Facilities in USA | ESSROC Cement Corp. | Undisclosed | Holcim Ltd. (SWX:HOLN) |
| 07/17/2015 | Lafarge North America Inc., Cement Assets | Continental Cement Company, LLC | Undisclosed | Lafarge North America Inc. |
| 06/11/2015 | Oldcastle Surfaces, Inc. | Seven Stone Surface Fabrication, Inc. | 7.7 | Oldcastle, Inc. (CRH plc) |
| 06/01/2015 | DuBROOK Concrete, Inc. | U.S. Concrete, Inc. (NasdaqCM:USCR) | 12.0 | Undisclosed |
| 5/4/2015 Announced | Holcim (US) Inc., Slag Grinding Plant in Chicago | Eagle Materials Inc. (NYSE:EXP) | 30.0 | Holcim (US) Inc. |
| 04/02/2015 | Ferrara Brothers Building Materials Corp. | U.S. Concrete, Inc. (NasdaqCM:USCR) | 60.0 | Joseph A. Ferrara, Leonard A. Ferrara and family |
| 03/17/2015 | Continental Cement Company, LLC | Summit Materials Holdings L.P. | Undisclosed | Summit acquired remaining stake |
| 02/24/2015 | Right Away Redy Mix, Inc. | U.S. Concrete, Inc. (NasdaqCM:USCR) | Undisclosed | Undisclosed |
| Source: Capital IQ | ||||
Private Equity Backed Valuations
Although merger & acquisition activity has been dominated by strategic acquirers as of late, private equity capital investment has returned to the post-recession construction industry. GF Data, a provider of detailed information on business transactions ranging in size from $10 million to $250 million, breaks down private equity transactions by industry and quantifies the average valuation multiple of revenue and earnings paid based on the purchase price. Figure 3 provides detail on the average size of transactions by NAICS code including transaction multiples for several aggregates related industries.
| Figure 3: Private Equity Transaction Valuation Data | ||||||
| NAICS Code: | 3273 | Cement and Concrete Product Manufacturing | ||||
| TEV Range | TEV ($mm) | Revenue ($mm) | EBITDA Margin | TEV/Revenue | TEV / EBITDA | |
| 25 – 100 | $48.0 | $45.7 | 17.6% | 1.1x | 6.8x | |
| NAICS Code: | 3279 | *Other Nonmetallic Mineral Product Manufacturing | ||||
| TEV Range | TEV ($mm) | Revenue ($mm) | EBITDA Margin | TEV/Revenue | TEV / EBITDA | |
| 10 – 50 | $27.8 | $24.0 | 20.8% | 1.2x | 5.7x | |
| * Subsector transforms mined or quarried nonmetallic minerals, such as sand, gravel, stone, clay, and refractory materials, into products for intermediate or final consumption. | ||||||
| NAICS Code: | 2123 | Nonmetallic Mineral Mining and Quarrying | ||||
| TEV Range | TEV ($mm) | Revenue ($mm) | EBITDA Margin | TEV/Revenue | TEV / EBITDA | |
| 25 – 250 | $69.3 | $57.8 | 22.0% | 1.2x | 5.7x | |
| Results are transaction averages for each NAICS code. | TEV = Total Enterprise Value | |||||
| Source: GF Data | ||||||
Private Equity Holdings
Private equity capital’s return to the construction industry has resulted in a number of aggregates related investments. A sampling of current U.S. private equity backed aggregates companies is included in Figure 4.
| Figure 4: Sample of U.S. Private Equity Backed Aggregates Companies | |||
| Investment Firm | City | State | Select Current Investment(s) |
| Altus Capital Partners | Wilton | CT | Rocla Concrete Tie |
| ARGUS Capital Partners | London | UK | Calucem, Inc. |
| Banyan Venture Partners | Salt Lake City | UT | Metro Readymix |
| Gateway City Capital Investors | Carlyle | IL | American Pavement Preservation |
| Goldman Sachs (GS Capital Partners VI Fund) | New York | NY | Associated Asphalt Inc. |
| J.H. Whitney & Co. | New Canaan | CT | FNF Construction, Inc. |
| JLL Partners | New York | NY | Pioneer Sand Company, Inc. |
| Lindsay Goldberg | New York | NY | Axeon Specialty Products, Bluegrass Materials Co. |
| Marwit Capital | Newport Beach | CA | Western Emulsions, Inc. |
| Merit Capital Partners | Chicago | IL | B.E.T.-ER Mix Inc. |
| Prophet Equity | South Lake | TX | Ace Asphalt of Arizona, Inc. |
| Salt Creek Capital | San Francisco | CA | Rock Ridge Stone Inc. |
| ShoreView Industries | New Canaan | MN | Angelle Concrete Group |
| Starboard Capital Partners | New York | CT | Jersey Precast Corp., Bright-Line Technologies |
| The Freedom Group | New York | IL | DiCicco Concrete Products, Kieft Brothers Inc. |
| Thompson Street Capital Partners | St. Louis | MO | Stone Panels, Inc. |
| Westward Partners | Seattle | WA | JMB Crushing Systems, Kalinko Enterprises Ltd. |
| WL Ross & Co. | New York | NY | PB Materials Holdings, Permian Basin Materials |
| Source: Capital IQ | |||
Aggregates Performance
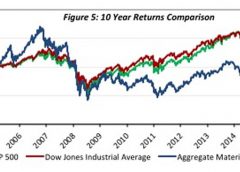
Over the past 10 years, major market indices outpaced growth in the aggregates industry (Figure 5), due in large part to the recession, but thus far in 2015 publicly traded aggregates producers are outperforming the S&P 500 and the Dow Jones Industrial Average (DJIA) (Figure 6). The publicly traded aggregates producers have generated a positive return this year while both the DJIA and S&P 500 returns turned negative for the year in August.

Aggregates Material Trends
Average industry pricing data shows cement, ready-mix concrete, sand & gravel and crushed stone prices increasing while asphalt prices plateaued and have begun to decline as a result of lower oil prices. Volumes have generally been increasing with the exception of asphalt which has been flat the last several years. Year-to-date cement, crushed stone and sand & gravel volumes have increased over the prior year.
Cement
Domestic production of cement in 2014 increased to ~81 million tons through output from 97 plants in 34 states. Production continues to be well below the record level of 99 million tons in 2005. 1
Asphalt
Asphalt pavement accounts for over 90% of road infrastructure in the United States. Government funding for highways is expected to increase in 2015 resulting in increased demand/revenue for asphalt producers.
Ready-Mix Concrete
The residential and non-residential building markets each consume approximately one-third of U.S. output. The final one-third is used for highways and utilities construction. The outlook is promising because construction markets for ready-mix concrete are all expected to experience growth over the next five years. 2
Crushed Stone
In 2014, 1.26 billion metric tons of crushed stone was produced by 1,550 companies operating 4,000 quarries, 91 underground mines, and 210 sales/distribution yards in 50 States. 1
Sand & Gravel
Construction sand and gravel valued at $7 billion was produced by an estimated 4,100 companies and government agencies from about 6,600 operations in 50 States. 1
 |
| Source: U.S. Geological Survey |
 |
| Sources: NRMCA Industry Data Survey, Average RMC selling price of U.S. Concrete, Vulcan Materials, Martin Marietta Materials & Eagle Materials |
 |
| Sources: EAPA Asphalt in Figures, Vulcan Materials & Martin Marietta Materials average of net asphalt selling prices |
 |
| Source: U.S. Geological Survey |
 |
| Source: U.S. Geological Survey |
Headwaters MB is an independent, middle-market investment banking firm providing strategic merger and acquisition, corporate finance, and merchant banking services through proprietary sources of capital. Named “Investment Bank of the Year” by the M&A Advisor in 2014, Headwaters MB is headquartered in Denver, with six regional offices across the United States and partnerships with 18 firms covering 30 countries. For more information, visit www.headwatersmb.com. To discuss any information contained in this report, contact the Headwaters MB team: Darin Good, managing director, [email protected], 303-549-5674; Brian Krehbiel, vice president, [email protected], 303-531-5008 and Charlotte Franson, vice president, [email protected], 303-809-8980.
1 U.S. Geological Survey, Mineral Commodity Summaries, January 2015
2 IBISWorld, Asphalt Manufacturing in the US Industry Report, May, 2015