
By Don Bleiwas, Physical Scientist, U.S. Geological Survey
 |
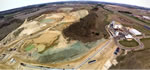
| An aerial view of a frac sand operation in Chippewa County, Wis., circa 2012 (Photograph provided courtesy of Jim Tittle at www.thepriceofsand.com) |
Background
The practice of fracturing reservoir rock in the United States as a method to increase the flow of oil and gas from wells has a relatively long history and can be traced back to 1858 in Fredonia, New York, when a gas well situated in shale of the Marcellus Formation was successfully fractured using black powder as a blasting agent. Nearly all domestic hydraulic fracturing, often referred to as hydrofracking or fracking, is a process where fluids are injected under high pressure through perforations in the horizontal portion of a well casing in order to generate fractures in reservoir rock with low permeability (“tight”). Because the fractures are in contact with the well bore they can serve as pathways for the recovery of gas and oil. To prevent the fractures generated by the fracking process from closing or becoming obstructed with debris, material termed “proppant,” most commonly high-silica sand, is injected along with water-rich fluids to maintain or “prop” open the fractures. The first commercial application of fracking in the oil and gas industry took place in Oklahoma and Texas during the 1940s. In 1949, over 300 wells, mostly vertical, were fracked (ALL Consulting, LLC, 2012; McGee, 2012; Veil, 2012) and used silica sand as a proppant (Fracline, 2011). The resulting increase in well productivity demonstrated the significant potential that fracking might have for the oil and gas industry.
The first horizontal well was successfully completed in 1948, and the first commercial “unconventional well,” a horizontal gas well in “tight” shale, was drilled in 1988. The Society of Petroleum Engineers describes unconventional resources as petroleum accumulations that are pervasive throughout a large area and are not significantly affected by pressure generated by water. The extremely small pore-size and absence of favorable permeability results in high resistance to hydrocarbon flow. Recovery of gas and oil from these units presents technological challenges. The extremely low permeability typically causes the hydrocarbons to remain in the source rock unless artificially induced fracturing is introduced and proppants are injected to maintain the fracture openings and to provide a pathway through the rock to facilitate the flow of hydrocarbons through the well (Ratner and Tiemann, 2014).
 |
| Figure 1. An illustration of a sedimentary cross-section that contains the Marcellus Shale in the Northeastern part of the United States. It depicts two examples of oil and gas wells developed with hydraulic fracturing in a pay zone and the advantage of horizontal drilling. The vertical portion of wells are drilled to depths that generally range from approximately 3,000 to 8,000 ft. (914 to 2,438 m) and the horizontal portion of holes generally range from 3,000 to 10,000 ft. (914 to 3,048 m) in length, but can be longer (Illustration not drawn to scale). [Vertical drill single-stage hole (A) with a relatively short pay zone (B); and A segment of horizontal multi-stage (5 stages shown) drill hole (C) showing a comparatively long pay zone (D).] Fractures induced by the high-pressure fracking process in each stage are propped open with proppants and provide pathways for the movement of oil and gas up the well. Image is modified from a figure provided as a courtesy of the Pennsylvania Independent Oil and Gas Association, 2014. |
In 1995, the first horizontally drilled and hydraulically fractured well in shale was completed (Martin, 2012; Williams, 2013). As illustrated in Figure 1, the advent of horizontal drilling combined with fracking permitted the greater recovery of oil and or gas from a pay zone by a single well over an extended area than that of a comparatively narrow intercept encountered in a vertical hole.
Technological advances in directional drilling and hydraulic fracturing coupled with increases in natural gas prices in the late 1990s and early 2000s spurred aggressive exploration drilling activities and eventually significant production from unconventional oil and gas reservoirs contained in several major sedimentary shale basins in the United States [U.S. Energy Information Administration (EIA), 2014]. Formations or basins, shown in Figure 2, include the Anadarko Basin in Oklahoma and Texas, the Bakken/Three Forks Basin in eastern Montana and North Dakota, the Barnett Formation in the Fort Worth Basin, the Eagle Ford and Woodbine Formations in the East Texas Basin, and the Appalachia Basin in the northeastern part of the United States (see Figure 2). Most of the production from these formations is in the form of gas rather than oil because methane molecules and those of natural gas liquids are smaller than crude oil molecules and are therefore more responsive to fracking when moving through fine-grained sedimentary rock such as shale (Ratner and Tiemann, 2014; Tucker, 2013).
 |
| Figure 2. Generalized flow map of the major oil and gas plays located in unconventional reservoirs that consume frac sand and the approximate locations of major sources that supply frac sand in the conterminous United States. Million metric tons consumed shown in parentheses. The Woodbine Formation also includes the Eagle Ford Formation in the East Texas Basin. Estimates are for the last three quarters of 2013 and 1st quarter of 2014. Solid, single-dot dashed, double-dot dashed, and dotted lines indicate directions of supply flow. Estimates and flows are subject to revision. Base map and consumption data provided courtesy of PacWest, 2014. |
As shown in Figure 3, daily U.S. gas and oil production from unconventional sources in 1980 amounted to about 1.1 million barrels of oil equivalent (MMBOE) per day. This was about 6 percent of the country’s daily MMBOE production. By 2010, the percentage of oil and gas from unconventional reservoirs increased to about 8 MMBOE per day, or nearly 46 percent of daily oil and gas production [International Energy Agency (IEA, 2012; 2012a)]. Much of the increase can be attributed to horizontal drilling accompanied by fracking. In 2013, oil produced from unconventional shale deposits represented 2.3 million barrels per day or 35 percent of domestic crude oil production (EIA, 2013; 2014; 2014a). The EIA reported that natural gas production from shales in the United States represented 10.4 trillion cubic feet (Tcf) [292 billion cubic meters (Bcm)] or 41 percent of total U.S. reported production of about 25.3 Tcf (716 Bcm) and an additional 5 TCF (142 Bcm) recovered from low porosity-permeability deposits (tight gas) (EIA, 2014). In 2012, up to 95 percent of wells drilled in the United States were hydraulically fractured and more than 43 percent of the country’s oil and 67 percent of natural gas production originated from wells that had been fracked (ALL Consulting, 2012). By 2015, it is anticipated that oil and gas recovered from unconventional deposits will approach 60 percent of total domestic production (IEA, 2012; 2012a).
 |
| Figure 3. Trends of estimated daily oil and gas production [expressed as million barrels of oil equivalent per day (MMBOE)] from domestic conventional and unconventional reservoirs from 1980 to projected daily production by 2015. 1P = Projected. Modified from International Energy Agency, 2012. |
Frac Sand as a Proppant
Frac sand, composed of about 95 to 99 percent silica as quartz, has been consumed as the major proppant for over 1 million hydraulically-fractured wells over the last 60 years in the United States (API, 2014). Frac sand has the highest consumption tonnage and total combined value of all natural and manufactured proppants consumed in the petroleum industry because of its relatively low unit cost, ready availability, and overall performance. It is recognized as an essential material for tapping the Nation’s unconventional oil and gas deposits. The use of the three major types of proppants sand, resin-coated sand (RCS), and ceramic alone or in combination, is based primarily on their cost (including shipping) and performance to maximize conductivity (flow-rate). The most important physical and chemical characteristics of a proppant to maintain conductivity are their abilities to withstand; (1) lithostatic pressure; (2), temperature; and (3) resistance to solutions.General characteristics of the three major types of proppants are shown in Figure 4. The specifications for frac sand are based on the standards determined by the American Petroleum Institute (API) and the International Organization for Standards (Zdunczyk, 2014).
 |
| Figure 4. Generalized comparison of physical characteristics differentiating the three major types of proppants used for fracking. In general, proppant cost increases toward the top of the triangle. Segments that contain the types of proppants presented are illustrative and do not reflect the relative proportions of proppant consumption or other characteristics of the materials. |
Based on statistics published by the U.S. Geological Survey (USGS) for the years 1990 through 2012, a total of approximately 654 million metric tons (Mt) of industrial silica sand valued at 20.3 billion U.S. dollars, adjusted to average 2013 dollars (avg. 2013$) free on board (FOB) plant, were sold and used in the United States (U.S. Geological Survey, 1991-2014). Of this amount, about 119 Mt, or 18 percent of that tonnage was used as proppant in hydraulically-fractured gas and oil wells with an estimated total value of about 6.6 billion dollars [avg. 2013$] or about 33 percent of the total industrial sand value (U.S. Geological Survey, 1991-2014).
Figure 5 is a time series chart that shows (1) the metric tons of silica sand proppant sold or used for each of the years during the period 1990 through 2012 (the most recent year for which statistical data is available) as reported by the USGS; (2) annual FOB plant values of frac sand termed “sold or used,” (because some are inventories and stockpiles), for each of the years during the period 1990 through 2012, as reported by the USGS, expressed in average 2013 dollars and; (3) the average number of active horizontal drilling rigs per week per year, as reported by Baker Hughes Inc. for the period 1991 (the first year that statistical data were available) through 2012 (Baker Hughes Inc., 2014). Frac sand values are FOB plant and do not account for the value added to some sands that are processed further on site, specifically RCS. From 1990 to 2002, the demand for sand as a proppant was relatively level averaging about 1.5 Mt per year or about 6 percent of the approximately 25 Mt of industrial sand sold or used annually during the period. The average price per ton of frac sand during this period was about $50 per ton FOB plant in average 2013 dollars. From 1990 to 2002, the number of onshore horizontal drilling rigs operating on a weekly basis in the United States averaged about 60 units or 7 percent of active onshore wells. Vertical and directional drilling rigs dominated U.S. onshore drilling activity over the time period with about a 73 and 20 percent share, respectively (Baker-Hughes, 2014).

|
| Figure 5. Average weekly horizontal drill rig count per year, frac sand sales, and free on board (FOB) mine values (Baker-Hughes, 2014; U.S. Geological Survey, 1991-2014). |
In 2003, nearly 2.2 Mt of sand was sold or used for fracking, a 45 percent increase over the previous year. The rapid growth in the demand for frac sand at this time was a direct result of the petroleum industry’s start of aggressive horizontal drilling and hydraulic fracturing programs in unconventional oil and gas targets contained in tight sedimentary formations. In 2009, the global recession and lower petroleum prices were reflected by a decrease in the number of active drilling rigs and a slowdown in the growth rate of frac sand consumption. By 2012, oil petroleum prices had recovered and the rate of growth in frac sand demand accelerated. In 2012, there was an average of approximately 1,150 horizontal rotary drilling rigs in the United States operating per week, which represented nearly 60 percent of the total number of active drilling rigs. At the same time, the number of vertical and directional (angled or deviated drilling, but not horizontal) active drilling rigs represented a 29 percent and 11 percent share, respectively (Baker Hughes Inc., 2014). The compound annual growth rate (CAGR) for frac sand sold or used for the years 2003 through 2012 was nearly 32 percent.
The USGS reported, based on voluntary respondents to a survey (a Congressionally approved method of data collection performed by the USGS), that approximately 31.1 Mt of silica sand was sold or used as proppant in 2012. Frac sand represented nearly 62 percent share of the industrial silica sand sold or used in the United States with an estimated value of nearly 2 billion dollars (avg. 2013) FOB plant. By 2012, the average price had risen to about $64 per ton FOB plant (U.S. Geological Survey, 1991-2014). In 2014, proppant sales FOB mine and factory in United States of sand, ceramic, and RCS proppants were anticipated to be about 4 billion dollars, an increase of about 20 percent over 2013. In 2014, frac sand was expected to represent an estimated 65 percent share of this amount with ceramics and RCS representing about roughly 20 and 15 percent, respectively (PacWest, 2014b). Estimates vary, but shares by weight in the 2011 to 2013 period represented approximately 80-90 percent for frac sand, with the balance split roughly equal between RCS and ceramics (Fielden, 2013; Hi Crush Partners LP, 2013; Hughes, 2013; Mawet and others, 2012; PacWest, 2014b; U.S. Geological Survey, 1991-2014; Thomas Curan, Analyst, FBR Capital Markets and Company, NY, NY, oral commun., August 12, 2014). Nearly 71 percent of the total tonnage of frac sand sold and used over the period 2003-2012 reported by the USGS occurred during the period 2008-12 and was valued at 4.7 billion dollars (2013avg$) FOB and reflects the U.S. petroleum industry’s rapid increase in drilling in unconventional oil and gas targets in tight formations which required frac sand as a proppant (U.S. Geological Survey, 1991-2014).
U.S. Production of Frac Sand
Frac sand production data are published in the U.S. Geological Survey Minerals Yearbook as regionally aggregated statistics. Published statistical data on frac sand production by State are limited. Reasons for this include: (1) some companies do not respond to USGS data collection questionnaires; (2) some companies consider production data confidential and the USGS is prohibited from publishing this type of data; (3) companies may report aggregated statistics for multiple frac sand operations in different states; (4) or combined sand production of which frac sand is a component; or (5) state government and local agencies do not collect data pertaining to frac sand production. The most recent published data, based on estimated regional U.S. production is available for 2012 by the USGS (U.S. Geological Survey, 1991-2014). However, discussions with local and State agencies; and industry representatives resulted in preliminary estimates of 2014 frac sand production among States with production of one Mt per year or greater. Based on preliminary estimates, which are subject to revision, approximately 54 Mt of frac sand will be produced in 2014 among the states listed in Table 1. An unknown, but relatively small portion of this production may have also been used to produce RCS. There are also states that produce relatively small amounts of frac sand, such as Ohio, with a reported 2012 production of nearly 65,000 metric tons (t) (Wolfe, 2013). Preliminary data suggest that frac sand production in 2014 will increase substantially over that reported in 2012 because of increased drilling activity and higher demand for frac sand. Demand for frac sand in 2014 will also be greater than that of 2013, but probably at a slower growth rate than the previous several years because of lower energy prices. Nearly 70 percent of the estimated 2014 domestic frac sand, or about 38 Mt, was mined in the Great Lakes Region owing to the premium sand deposits in the region; existing railway infrastructure, and long term presence in the industry (see Table 1). The states that comprise this region and their respective estimated annual production, rounded to the nearest Mt listed in descending order are Wisconsin (24 Mt), Illinois (8 Mt), Minnesota (5 Mt), and Michigan (1 Mt). Deriving an estimate for frac sand production in Wisconsin was more difficult than some other States owing to the large number of permits granted for mining over the last several years, but with fewer operations actually developed and producing than permitted. This resulted in a wide range of production estimates.
|
||||||||||||||||||||||||||||||||||||
| Table 1. Preliminary estimate of 2014 frac sand production by states determined to produce more than 1 million metric tons (Mt) per year. An unknown, but relatively small, percentage of production may be used for the manufacture of RCS. *Preliminary estimates and subject to revision. **Percentages exceed 100 because of independent rounding. |
Common names of the frac sands, which are mined from the Ordovician Saint Peter Sandstone, include Jordan Sand, Ottawa Sand, Northern White Sand, Saint Peter; and Sierra Gold. In addition, these sands are also used in glass making and in foundries. Figures 6a and 6b are photographs of a vertically integrated frac-sand facility in the Great Lakes Region and a sample of the Region’s premium quality frac sand.
 
|
| Figures 6a (top) and 6b (bottom). Figure 6a is an aerial photograph of a vertically integrated frac sand facility near Maiden Rock, Wis., circa 2012. Some frac sand facilities (including this one, since the photograph was taken) have constructed covered storage facilities to protect stockpiled sands from the effects of weather. Train cars have a capacity of about 100 short tons, which form unit trains that may exceed 100 rail cars. (Photograph provided courtesy of Jim Tittle at www.thepriceofsand.com). Figure 6b is an image of high-quality frac sand mined and processed in Minnesota. Note the uniform size and spherical shape of grains, lack of fines and nearly pure quartz-grain mineralogy. (Photograph provided courtesy of Minnesota Environmental Quality Board, 2014.) |
Iowa and Missouri produce approximately 2 million metric tons per year (Mt/yr) and 1 Mt/yr of frac sand, respectively. These sands are similar in character to the frac sands produced in the Great Lakes Region. Nearly all of the premium sands are transported by rail to transfer points in areas where fracking is occurring and trucked to fracking sites or stockpiled at locations to await orders for frac sand (see Figure 2). Some Great Lakes frac sand is also shipped to Canadian fracking sites since Canada produces only about 30 percent of its frac sand requirements (Seeking Alpha, 2014). In 2014, Canada imported about 1.5 Mt of sand from the United States. Most of the remaining frac sand production in the United States, approximately 13 Mt rounded to the nearest Mt, originates from outside the Great Lakes Region. In descending order of production they are: Texas (8 Mt), Arkansas (2 Mt), Nebraska (2 Mt) and Arizona (1 Mt). A large percentage of the sand produced from the mines in these states is considered “brown sand” and sold as Brady, Brown, EF (economical frac), Hickory, and Texas Brown. These sands may contain minor amounts of impurities, have lower strength and sphericity, and have other properties that may contribute to lower conductivity and value than the “white sands” of the Great Lakes Region (Levson and others, 2012; Texas Frac Sands, 2014). Frac sands produced from these areas are also shipped to numerous states as they are suitable for use in some basins with relatively shallow wells. The production from these mines is considered very important to consumers of frac sand at oil and gas plays located in relatively close proximity to the frac sand mines because of comparatively low transportation rates as shown in Figure 2 and Table 2. The top three frac sand consuming units or basins in the United States and the amount used are, in descending order of estimated consumption, the Eagle Ford and Woodbine Formations in the East Texas Basin (9.5 Mt), Appalachia (6.8 Mt) and the Permian (5.3 Mt).
Regional Frac Sand Consumption in Major U.S. Unconventional Oil and Gas Plays
In 2013, untreated frac sand was used exclusively in almost 75 percent of horizontal wells, and comprised 90 to 95 percent of the total tonnage of proppant used in wells fracked in the United States. As shown in the map on Figure 2 and Table 2, during the last three quarters of 2013 through the first quarter of 2014, a total of about 31 Mt of frac sand, about 66 percent of estimated 2013 U.S. frac sand production, was consumed in the identified plays. These areas represent the basins where much of the exploration for and production from unconventional oil and gas reservoirs in shales occurs. Frac sand was also used in horizontal drill holes in other basins and some vertical holes in areas not shown on the map. Additional tonnages are: used for well development in other areas of the United States and shipped to Canada; in transit; and maintained in inventory and stocks at plant facilities and distribution sites (Rock Products, 2014a). Frac sand stockpiles at mining facilities and storage sites in proximity to fracking activities may exceed 100,000 t (Sierra Frac Sands, LLC, 2014). In 2014, roughly 3-4 Mt will be exported, primarily to Canada (Claim Post Resources, 2013; PacWest, 2014b).
|
||||||||||||||||||||||||||||||||||||||||||||||||||||||||||||||||||||||
| Table 2. Major unconventional oil and gas plays in the United States and estimated metric tons of frac sand consumption. *Tonnage and percentage estimates are based on data for the last three quarters of 2013 and 1st quarter of 2014. **Numbers do not add up to 100 percent because of rounding to the nearest whole percent. All estimates are subject to revision. Data from PacWest (2014b). |
Fracking operations in the Eagle Ford and Woodbine Formations, in the East Texas Basin in Texas, were the largest user of frac sand among the major plays shown in Figure 2 and Table 2 with consumption of about 9.5 Mt. The Basin has significant oil and gas production and high potential for long term future production. Most of the targets in the Basin are relatively shallow compared to the Bakken portion of the Williston Basin and some other producing shale basins, but there is also high potential for production from deep wells which are geologically attractive because of the potential for production from multiple stratigraphic zones, and less tight reservoir rock than some other basins (Schaefer, 2012). Interest in the Eagle Ford Formation in the Basin is demonstrated by the increase in the number of drilling permits issued. In 2010, about 1,000 permits were issued and in 2012 that number had increased to about 4,100 (King, 2014). At the end of September 2014 there were 244 rigs drilling horizontal wells and 15 drilling vertical wells in the Eagle Ford Formation, representing nearly 15 percent of all active drilling rigs in the United States (Eagle Ford Shale, 2014).
From 2009 through 2012 there was a 100 percent drilling success rate for production of oil and gas in the core area of the Woodbine portion of the play (Woodbine Acquisition, Inc. 2012). Frac sand consumed in the Basin represented about 30 percent of the frac sand consumed among all of the major plays listed in Table 2 and shown in Figure 2. Frac sand comprised about 95 percent of the proppant consumed in the play owing to the relatively shallow depths of the reservoirs and local sources of comparatively low-cost sand.
In respect to proppant use, the horizontal wells developed in the Bakken Formation hosted in the Williston Basin of Montana and North Dakota are an exception with the lowest percentage of sand used relative to other proppants among the current oil and gas plays in the United States. Figure 7 illustrates the Bakken Formation in the Williston Basin in Western North Dakota and Eastern Montana and the general trend for the use of proppant related to depth. The Bakken Formation has been estimated by the to contain a mean resource of 3.65 billion barrels of undiscovered recoverable oil and trillions of cubic feet of natural gas and is producing about 1 million barrels of oil per day (EIA, 2014; U.S. Geological Survey, 2013). It is anticipated by some analysts that the portion of the Formation located in North Dakota will produce about 1.6 million barrels of oil per day, plus natural gas in 2017 (Reuters, 2013). In mid-September, 2014, there were approximately 197 active drilling rigs in the Bakken-Three Forks Basin (189 of these in North Dakota) of which 178 rigs were drilling horizontal wells (Bakken Shale, 2014). About 69 percent, by weight, of the proppant used in the Basin was frac sand, 24 percent was ceramic, and 7 percent was RCS (PacWest, 2014b). The high heat and pressure associated with wells developed in the deepest part of the Williston Basin limits the use of frac sand to well depths of about 2,500 meters (m). In order to maximize production and longevity, the use of mixtures of proppants in differing proportions of sand, RCS, and ceramic proppant predominate at well depths deeper than 2,500 m. Most of the deepest wells in the Basin use a mix of RCS and ceramic proppant, which exhibit superior performance under higher pressure-temperature conditions than most sand, but at a higher cost per unit (PacWest, 2014b).
 |
| Figure 7. East-west cross-section showing the depth to the Bakken Formation in the Williston Basin of Western North Dakota and Eastern Montana and generalized trend of proppant types used in fracked wells. Mixtures of proppants in varying proportions are commonly used for maximizing conductivity and controlling cost. Selection generally corresponds with pressure and temperature conditions associated with the depth of wells (see map inset in upper left corner). Depths are shown as feet below sea level. Add approximately 1,800 ft. (550 m) for depth below surface. [Figure modified from EIA, 2014b and provided courtesy of Meg Coleman, EIA; NDGS, 2010, and PacWest, 2014]. |
In 2008, most horizontal drilling in the Bakken Formation concentrated on the eastern margins of the Williston Basin, reaching depths of about 2,100 m. By 2013, some wells were exceeding 3,000 m and the horizontal portion of these also increased substantially from about 1,500 m, with 10 stages, to about 3,000 m, with 32 stages. A stage is an interval within the wellbore in which fracking of the surrounding rock is performed. Multi-stage fracking is performed by temporarily isolating portions of a single wellbore multiple times with plugs in order to produce high water pressure and get maximum fracturing results in the most geologically productive intervals (Judice, 2012; Schlumberger, 2014b). The increase in the number of stages and greater depth resulted in greater consumption of proppant per hole and a greater variety of proppants to maximize conductivity. In the deepest parts of the Williston Basin, where depths are on the order of 3,400 m below the surface, there is a greater proportion of RCS and ceramic as a proppant with the deepest holes which approach over 3,000 m in depth using predominantly ceramic or solely ceramic proppant. Some wells also have different proportions of proppants for different stages (DTC Energy Group, Incorporated, 2013; Nordeng and Helms, 2010; Petroleum News Bakken, 2014; Schaefer, 2013; U.S. Geological Survey, 2013).
As shown in Table 2 and Figure 2, consumption of frac sand in the Appalachian region in the Northeastern United States and the Permian Basin, mostly in Texas, consumed approximately 6.8 Mt (22 percent) and 5.3 Mt (17 percent), respectively (PacWest, 2014b).
Technological Advances Increase Proppant Consumption Per Well
The surge in frac sand consumption relative to the number of active horizontal drilling rigs has increased substantially over the last several years. This results from numerous factors that include: 1) application of advanced technologies such as: (a) multi-stage and higher density hydraulic fracturing per well, which increased from an average of about 3.4 hydraulic fracturing stages in 2008 to over 13 at the beginning of 2012. In 2014, wells with 30 stages were not uncommon and some wells have as many as 50 stages; (b) methods that result in more extensive fracturing in bedrock; and (c) reservoir stimulation of older wells by hydraulic fracturing; 2) improved efficiencies by drilling multiple holes from one site with closer spacing; and 3) refreshing of previously fracked wells by re-fracking (CBC News, 2014; Helman, 2014; McDivitt, 2014; Nangia, 2013; Schaefer, 2009; Schlumberger, 2014a; Spencer, 2014; Tucker, 2013). These advances have increased the average proppant consumption per well. For example, in 2008, the average amount of proppant, which was nearly all sand, used per horizontal well was approximately 900 t for a 1,500 m well. In 2010, the average amount of sand used was closer to 2,300 t for a well completed on a 3,000-m length measured horizontally. In 2014, an average horizontal well consumed from 4,100 to nearly 5,000 t of proppant of which over 90 percent, by weight, was sand, equivalent to 40 to 50, 100 short-ton capacity train car loads. In a few recent cases, wells required about 9,000 t of sand (Cadre Proppants, 2013; Fielden, 2013; Rock Products, 2014). Also, a well may be refracked multiple times over its life to increase production or refresh the well (Streetwise Reports, 2013; Tate, 2014). For the purpose of comparison, from 2011 through mid-2014, the amount of proppant required for fracking a vertical drill hole, nearly all of which was sand, remained essentially level, at about 230 t per well (Down Hole Trader, 2014; Geiver, 2014; PacWest, 2014b).
The average amount of proppant used per unit distance for horizontal holes is expected to continue to climb with improved fracturing technologies, closer-spaced and increased number of stages per drill hole, and refreshing of previously developed wells.
Frac Sand Reserves and Resources
Published data pertaining to the total amount and distribution of frac sand reserves and resources in the United States are not available. Reserve data are published by some publicly traded companies in annual reports and other media mostly as aggregated estimates for multiple operations. For example, U.S. Silica, a publicly traded company, and among the largest producers of frac sand in the United States, reported combined reserves of 124 Mt among 15 operations across the country that meet API specifications for frac sand and control about 260 Mt of overall reserves (Yahoo Finance, 2014). Meeting API standards suggests that this is high-quality frac sand. In 2012, U.S. Silica stated that they have 40 to 45 years of frac sand reserves (Rigzone, 2012). In some cases, companies provide site specific data. For example, Hi-Crush Partners LP, also a publicly listed company, announced that they have a reserve of high quality frac sand at a company-owned facility in Wisconsin of about 57 Mt and an interest in another frac sand facility, also in Wisconsin, with about 43 Mt of reserves (ETF Channel, 2014).
Some privately owned companies do not make reserve information public, however Preferred Sands, LLC, recently published a frac sand reserve estimate of nearly 24 Mt in Wisconsin and 73 Mt in Nebraska (Younger, 2013; Preferred Sands, 2014). Northern Frac Proppants reports a reserve in excess of 35 Mt at their Alma Center, Wisconsin, frac sand operation and over 50 Mt at their undeveloped Jackson, Wisconsin, site (Northern Frac Proppants, 2014). Sierra Frac Sand, LLC, also published a frac sand reserve estimate of approximately 36-90 Mt at their operations in Minnesota and Wisconsin and about 36 Mt in Texas (Sierra Frac Sand, LLC, 2014).
A cursory review of published reserve data coupled with (1) the high number of permit applications for development of new frac sand mines in Wisconsin and other states; (2) mine life estimates and expansion plans for established operations; and (3) thickness and areal distribution of geologic formations in the Great Lakes Region, Texas, and other areas that contain favorable geology to host sand deposits that meet the frac sand specification requirements, suggests that the United States’ reserves and resources at current prices are sufficient to meet demand for fracking requirements for the foreseeable future. Some of these deposits may not be developed because of factors that include thick overburden and other geologic and engineering challenges, absence of infrastructure, such as power and nearby rail transportation; and lack of available water, environmental concerns, preexisting development, societal pressure, and issues related to permitting.
Frac Sand Pricing
As a result of high demand and tight supply, the price of frac sand in 2013 increased to a national average of about $63 (avg. 2013) per ton FOB plant from about $50 (avg. 2013) per ton FOB plant in 1990 (U.S. Geological Survey,1991-2014). As discussed previously, the major factors that determine the cost and application for frac sand include: (1) grain strength, which is based on its SiO2 content and internal structure; (2) grain sphericity; (3) grain size; (4) grain size distribution; (5) and overall purity. In general, the relatively clean, coarse and high-silica high-strength “white” sands mined in Arkansas, Illinois, Minnesota, and Wisconsin bring the highest prices, averaging about $55 per ton FOB plant. The coarser-cleaner fractions bring premium prices of approximately $70 per ton FOB plant, because of higher conductivity which is especially desirable for the recovery of oil. In most cases, rail is the primary form of transportation to get sand from the mine to a transfer point and then, from there, trucked to the well site, and represents the highest post-mine cost. Adding to the cost burden of transportation some suppliers and consumers of frac sand are affected with logistical “bottlenecks” that result from the: lack of available hopper cars, limitations of branch lines to accommodate rail traffic, weight, and speed; complications associated with moving sand through the network of rail freight carriers that traverse the Midwest United States; shortages of truck drivers and truck availability; and constrained capacity at trans loading terminals (Gopinath and Pramanick, 2014; Minnesota Department of Transportation, 2012; Vectora Transportation, 2013).
Depending on the modes of transport, distances traveled, and number of transfer points, the cost of white frac sand may reach $170 per ton by the time it arrives at the well site (PacWest, 2014b). In 2013, brown sand represented about 35 percent by weight of the untreated sand used for fracking (PacWest, 2014b). In general, the brown sands mined in Louisiana and Texas are finer grain-sized, less spherical and lower purity quartz than Northern sand. They are generally considered lesser quality because of lower silica content with commensurate lower-strength and lower conductivity. Their relatively low resistance to pressure generally limits their use to a fracking depth of about 2,400 m. The sands are priced at about $65 per ton FOB plant (Ashwill, 2012; Carbo Ceramics, 2012; Lyle, 2011; PacWest, 2014b; U.S. Geological Survey, 1991-2014). On average, they are burdened with higher mining costs than mines in the Great Lakes Region, but experience significantly lower transportation costs because of the shorter distance and fewer transit points necessary to reach the well site.
Conclusion
Natural gas and oil recovered from fracking unconventional deposits has captured a significant share of current U.S. production. More than 80 percent of the natural gas wells developed in the United States over the next ten years are expected to require fracking and it is projected that by 2035 natural gas from fracked wells will represent more than a 75 percent share of the domestic supply. The EIA details how surging domestic oil production has narrowed net petroleum imports – from 60 percent of U.S. requirements in 2004 to 38 percent in 2013 (API, 2014a; 2014b).
The United States is the largest producer and consumer of frac sand in the world. Of the approximately 54 Mt of frac sand produced in 2014, the greatest percentage share required for tapping into unconventional deposits originated from the Great Lakes Region and Texas. These areas will likely continue to represent the largest production shares through the end of the decade as expansions at existing mines occur and new mines are developed. Further mine development in other states, such as Arkansas, and new mine development in Canada will also contribute additional supplies of frac sand. It has been estimated that frac sand consumption in the United States could approach 70 Mt by 2016 (PacWest, 2014a; Progressive Railroading, 2014). This amount of frac sand would have a value exceeding 4 billion dollars FOB plant as established plays are refreshed and further developed, and new plays are exploited (Hoerth, 2014). This consumption estimate is well within the limits of anticipated effective U.S. frac sand capacity. U.S. growth in consumption of frac sand was dramatic during the 4-year period of 2009 through 2012 with an estimated 49 percent CAGR as development of unconventional deposits was aggressively pursued. Barring factors that could negatively affect frac sand demand, such as major technological breakthroughs and/or a drop in oil and gas prices that are considered to be long term by the petroleum industry, frac sand will continue to represent the largest tonnage used among proppants and the highest total value for fracking until at least the year 2020, based primarily on: (1) its satisfactory performance in most applications; (2) its availability; and (3) its lower price compared to alternative materials. The average amount of proppant used per unit distance for horizontal holes is expected to continue to climb with improved fracturing technologies, closer-spaced stages and increased number of stages per drill hole. Demand for proppant will also increase as more previously drilled wells are refreshed, established ones further exploited, and new oil and gas fields are developed.
References Cited
- ALL Consulting, LLC, 2012, The Modern Practices of Hydraulic Fracturing: A Focus on Canadian Resources, accessed July 28, 2014, at http://www.capp.ca/getdoc.aspx?DocId=210903.
- America Petroleum Institute (API), 2014a, Oil and natural gas overview: Hydraulic fracturing Q & A’s, accessed July 31, 2014, at http://www.api.org/oil-and-natural-gas-overview/exploration-and-production/hydraulic-fracturing/hydraulic-fracturing-qa.aspx.
- American Petroleum Institute (API), 2014b, Hydraulic fracturing, Unlocking America’s natural gas resources, accessed September 10, 2014, at http://www.api.org/oil-and-natural-gas-overview/exploration-and-production/hydraulic-fracturing/~/media/Files/Oil-and-Natural-Gas/Hydraulic-Fracturing-primer/Hydraulic-Fracturing-Primer-2014-highres.pdf.
- Ashwill, Vickie, 2012, Energy services companies head to the sand pit, Houston Business Journal, August 10, 2012, accessed August 27, 2014, at http://www.bizjournals.com/houston/print-edition/2012/08/10/energy-services-companies-head-to-the.html?page=all.
- Baker Hughes Inc., 2014, Rig Count, accessed July 30, 2014, at http://www.bakerhughes.com/rig-count/.
- Bakken Shale, 2014, Bakken shale rig count, accessed October 2, 2014, at http://bakkenshale.com/tag/rig-count/.
- Cadre Proppants, 2013, Cadre proppants to sell 40/70 Premium Hickory Sand, accessed September 25, 2014, at http://www.cadreproppants.com/news/cadre-proppants-to-sell-40/70-premium-hickory-sand/.
- CARBO Ceramics, 2012, Proppants 101: An introduction to proppants and their properties, accessed August 12, 2014, at http://www.slideshare.net/SS_CARBO-ceramics/proppant-101-atce2012.
- CBC News, 2013, Multi-stage fracking sparked energy revolution, accessed July 31, 2014, at http://www.cbc.ca/news/canada/calgary/multi-stage-fracking-sparked-energy-revolution-1.1338662.
- Claim Post Resources, 2013, Claim Post Resources Inc. enters into an agreement to purchase Manigotagan frac sand projects, accessed October 28, 2014, at http://www.marketwired.com/press-release/claim-post-resources-inc-enters-into-agreement-purchase-manigotagan-frac-sand-project-tsx-venture-cps-1805441.htm.
- Down Hole Trader, 2014, Please sir, may I have some sand?, accessed September 5, 2014, at http://downholetrader.com/archives/1926.
- DTC Energy Group, Incorporated, 2013, Bakken 5-year drilling & completion trends, accessed September 5, 2014, at http://www.dtcenergygroup.com/bakken-5-year-drilling-completion-trends/.
- Eagle Ford Shale, 2014, Eagle Ford Shale drilling rig count, accessed October 10, 2014, at http://eaglefordshale.com/drilling-rig-count/.
- ETF Channel, 2014, HCLP description – Hi-Crush Partners LP, accessed October 9, 2014, at http://www.etfchannel.com/symbol/hclp/.
- Fielden, Sandy, 2013, Mr. Sandman—Getting proppant to the wellhead: RBN Energy LLC, August 1, 2013, accessed September 23, 2014, at https://rbnenergy.com/mr-sandman-getting-proppant-to-the-wellhead.
- Fracline, 2011, A brief history of proppants, accessed July 31, 2014, at http://momentivefracline.com/a-brief-history-of-proppants.
- Geiver, Luke, 2014, Entering the frack sand industry, The Bakken Magazine, April 22, 2014, accessed August 13, 2014, at http://www.thebakken.com/articles/602/entering-the-frack-sand-industry.
- Gopinath, Swetha and Pramanick, Anannaya, 2013, Halliburton, Baker Hughes Inc. buys more sand railcars as demand piles up, Reuters, October 21, 2014, accessed October 27, 2014, at http://www.reuters.com/article/2014/10/21/oil-fracking-idUSL3N0SG6B520141021.
- Helman, Christopher, 2014, Maybe BHP Billiton’s $20B fracking bet wasn’t a blunder after all, Forbes, June, 3, 2014, accessed July, 31, 2014, at http://www.forbes.com/sites/christopherhelman/2014/06/03/maybe-bhp-billitons-20b-fracking-bet-wasnt-a-blunder-after-all/2/.
- Hi Crush Partner LP, 2013, Investor presentation, accessed September 19, 2014
- Hoerth, Casey, 2014, Hi Crush Partners—Playing in frac sand: Real Money, March 19, 2014, accessed October 28, 2014, at http://realmoney.thestreet.com/articles/03/19/2014/hi-crush-partners-playing-frac-sand.
- Hughes, Emma, 2013, Proppants market could be worth $10bn by 2017, Industrial Minerals, accessed July 29, 2014, at http://www.indmin.com/Article/3251450/Proppants-market-could-be-worth-10bn-by-2017.html.
- International Energy Agency (IEA), 2012, World energy outlook 2012, Presentation to the press, London, November 12, 2012, accessed August 21, 2014, at http://www.iea.org/newsroomandevents/speeches/weo_launch.pdf.
- International Energy Agency (IEA), 2012a, World energy outlook 2012, International Energy Agency 9 rue de la Fédération, 75739 Paris Cedex 15, France, 668 p. [Also available online at http://www.iea.org/publications/freepublications/publication/WEO2012_free.pdf.]
- Judice, Donato, 2012, Hydraulic fracturing 101, Bureau of Land Management, accessed October 8, 2014 at
- King, Hobart, 2014, Eagle Ford Shale, Geology.com accessed October 1, 2014, at http://geology.com/articles/eagle-ford/.
- Levson, V.P., Pyle, L., and Fournier, M., 2012, Identification of potential silica sand deposits in the Northwest Territories, Canada : Northwest Territories Geoscience Office, Northwest Territories Open File 2012-6, 76 p.
- Lyle, Don, 2011, Proppants, Proppants open production pathways, Hart Energy Publishing, accessed August 12, 2014, at https://www.slb.com/~/media/Files/stimulation/industry_articles/201101_ep_proppant_design.ashx.
- Martin, J.P., 2012, Unconventional resource development and the environment: The curious situation in New York, accessed July 31, 2014, at http://blogs.artvoice.com/avdaily/wp-content/uploads/2012/04/John-Martin-Jakarta-2-6-2012.pdf.
- Mawet, P.J., Fleming, A.C., and Nichols, J.H., 2012, Eight leading practices for the proppants supply chain, Accenture, 20 p. Accessed July 31, 2014, at http://www.accenture.com/us-en/Pages/insight-eight-leading-practices-proppant-supply-chain.aspx.
- McDivitt, Herschel, 2014, Hydraulic fracturing 101, Indiana Division of Oil and Gas, accessed August 13, 2014, at http://www.in.gov/dnr/dnroil/files/og-Hydraulic_Fracturing_Data_for_Oil_and_Gas_Wells.pdf.
- McGee, Jerry, 2012, The evolution of the proppant industry, Keynote address at the Proppants Summit: Overcoming the shortage from mine to well, Denver, Colorado, July 23-25, 2012. Available at http://www.cadreproppants.com/files/120724%20Denver%20Conference%20Cadre%20Proppants.pdf.
- Minnesota Department of Transportation, 2012, Southeast Minnesota regional freight study, Regional business interviews, accessed October 27, 2014, at http://www.dot.state.mn.us/ofrw/freight/PDF/InterviewSummaries.pdf.
- Nangia, Samir, 2013, Proppant IQ, Proppant market analysis, accessed July 31, 2014, at http://pacwestcp.com/wp-content/uploads/2013/10/PacWest-ProppantIQ-Overview-Oct-2013.pdf.
- Younger, Sally, 2013, Sand rush—Fracking boom spurs rush on Wisconsin Silica: National Geographic News, July 3, 2013, accessed October 8, 2014, at http://news.nationalgeographic.com/news/energy/2013/07/130703-wisconsin-fracking-sand-rush/.
- Nordeng, S. H. and Helms, L.D., 2010, Bakken Source System Three Forks Formation Assessment: North Dakota Department of Mineral Resources, 22 p.
- Northern Frac Proppants, 2014, Operations overview, accessed October 16, 2014, at http://nfproppants.com/#.
- PacWest, 2014a, ProppantIQ, market outlook 14Q2, accessed October 31, 2014, at http://pacwestcp.com/market-outlook/proppantiq/.
- PacWest, 2014b, Proppant market analysis, First quarter 2014 release, PacWest Consulting Partners, Houston, TX, 105 p.
- Petroleum News Bakken, 2014, The Bakken explorers, accessed August 27, 2014, at http://www.petroleumnews.com/bkpdfarch/Bakken_Exp_2014.pdf.
- Preferred Sands, 2014, Preferred Sands of Genoa, accessed September 24, 2014, at http://www.preferredsands.com/company/nebraska.html.
- Progessive Railroading, 2014, Rail news: Canadian National Railway; Frac sand: CN begins to serve another Wisconsin plant; Claim Post touts Manitoba Reserves, accessed October 31, 2014, at http://www.progressiverailroading.com/canadian_national/news/Frac-sand-CN-begins-to-serve-another-Wisconsin-plant-Claim-Post-touts-Manitoba-reserves–42024.
- Ratner, Michael and Tiemann, Mary, 2014, An overview of unconventional oil and natural gas: Resources and Federal actions, Congressional Research Office, 7-5700, accessed July 28, 2014, at http://fas.org/sgp/crs/misc/R43148.pdf.
- Reuters, 2013, North Dakota oil output may double by mid-2017-state official, accessed September 9, 2014, at http://www.reuters.com/article/2013/09/27/energy-northdakota-forecast-idUSL2N0HN27820130927.
- Rock Products, 2014, Study predicts growth in frac sand consumption, accessed August 8, 2014, at http://www.rockproducts.com/frac-sand/13384-study-predicts-growth-in-frac-sand-consumption.html#.U-PSwWd0yXE.
- Rock Products, 2014a, Halliburton, Baker Hughes Inc. stockpiling sand, accessed October 23, 2014, at http://www.rockproducts.com/frac-sand/13804-halliburton-baker-hughes-stockpiling-sand.html#.VFDbIWd0xes.
- Rigzone, 2012, U.S. Silica “well positioned” to meet fracking sand demand, accessed October 9, 2014.
- Schaefer, Keith, 2009, What’s a frac-or WAF?, in Oil and Gas Investments Bulletin, accessed July 31, 2014, at http://oilandgas-investments.com/2009/natural-gas/whats-a-frac-or-waf/.
- Schaefer, Keith, 2012, Investing in the Eagle Ford Shale play, May 25, 2012, Oil and Gas Investments Bulletin, 2012, accessed October 1, 2014, at http://oilandgas-investments.com/2012/investing/investing-in-the-eagle-ford-shale-oil-play/.
- Schaefer, Keith, 2013, Digging deeper into the Bakken: The Three Forks Oil Formation, Oil and Gas Investments Bulletin, November 6, 2013, accessed September 2, 2014, at http://oilandgas-investments.com/2013/energy-services/bakken-oil-three-forks-formation.
- Schlumberger Ltd., 2014a, Multi-stage stimulation systems, accessed July 31, 2014, at http://www.slb.com/services/completions/completion_products/multistage_stimulation_systems.aspx.
- Schlumberger Ltd., 2014b, Oilfield glossary, Staged fracturing, accessed October 8, 2014 at http://www.glossary.oilfield.slb.com/en/Terms/s/staged_fracturing.aspx.
- Seeking Alpha, 2014, Firebag River – A red-hot Canadian frac sand deposit? Accessed October 31, 2014, at http://www.nasdaq.com/article/firebag-river-a-red-hot-canadian-frac-sand-deposit-cm355909.
- Sierra Frac Sands, LLC, 2014, Company website, accessed October 6, 2014, at http://www.sierrafracsand.com/products/lgc-proppant.html.
- Spencer, Starr, 2014, Operator outputs from US oil and natural gas resource plays continues to leapfrog, accessed September 9, 2014, at http://blogs.platts.com/2014/08/12/shale-production-increases/.
- Streetwise Reports, 2013, The energy report, Keith Schaeffer names the last-standing shale plays, accessed October 10, 2014, at http://www.theenergyreport.com/pub/na/keith-schaefer-names-the-last-standing-shale-plays.
- Tate, Kristin, 2014, New phenomenon, “refracking” sweeping gas and oil industry, accessed October 29, 2014, at http://www.breitbart.com/Breitbart-Texas/2014/08/23/New-Phenomenon-Refracking-Sweeping-the-Gas-and-Oil-Industry.
- Texas Frac Sands, 2014, Brady, Texas, area frac sand—Product specifications, accessed October 8, 2014, at http://texasfracsands.com/id1.html.
- Tucker, Rex, 2013, The state of the proppant industry, accessed July 30, 2014, at http://www.cadreproppants.com/files/3rd%20Proppants%20Summit%20Presentation.pdf.
- U.S. Department of Labor, U.S. Bureau of Labor Statistics, 2014, CPI Inflation Calculator, accessed July 24, 2014, at http://www.bls.gov/data/inflation_calculator.htm.
- U.S. Energy Information Administration (EIA), 2013, AEO2014 early release overview, accessed September 5, 2014, at http://www.eia.gov/forecasts/aeo/er/early_production.cfm.
- U.S. Energy Information Administration (EIA), 2014, Annual energy outlook 2014, accessed August 21, 2014, at http://www.eia.gov/forecasts/aeo/MT_naturalgas.cfm.
- U.S. Energy Information Administration (EIA), 2014a, Natural gas, accessed August 21, 2014, at http://www.eia.gov/dnav/ng/ng_prod_sum_dcu_NUS_m.htm.
- U.S. Energy Information Administration (EIA), 2014b, Today in energy, Bakken fuels North Dakota’s oil production growth, accessed September 6, 2014, at http://www.eia.gov/todayinenergy/detail.cfm?id=17391.
- U.S. Geological Survey,1991-2014, Industrial sand and gravel in Metals and minerals: U.S. Geological Survey Minerals Yearbooks 1990-2012, various pagination, accessed July 31, 2014 at http://minerals.usgs.gov/minerals/pubs/usbmmyb.html and http://minerals.usgs.gov/minerals/pubs/commodity/silica/.
- U.S. Geological Survey, 2013, Science features, USGS releases new oil and gas assessment for Bakken and Three Forks Formations, accessed September 9, 2014, at http://www.usgs.gov/blogs/features/usgs_top_story/usgs-releases-new-oil-and-gas-assessment-for-bakken-and-three-forks-formations/.
- Vectora Transportation, 2013, Proppant supply in the Permian Basin, accessed October 27, 2014, at http://vectoratransportation.com/proppant-supply-in-the-permian-basin/.
- Veil, John, 2012, Hydraulic fracturing and the challenges of managing wastewater, accessed July 31, 2014, at http://www.makingwaterconnections.com/wp-content/uploads/2012/05/Veil_Hydraulic-Fracturing-and-the-Challenges-of-Managing-Wastewater.pdf.
- Williams, J.H., 2013, The Marcellus Shale gas play, Geology, development, and water-resource impact mitigation, Presentation, November 17, 2011 at the University of Connecticut Groundwater Research Program, University of Connecticut, Storrs, accessed August 9, 2014, at http://ny.water.usgs.gov/projectsummaries/CP30/Marcellus_Presentation_Williams.pdf.
- Wisconsin Department of Natural Resources, 2012, Silica sand mining in Wisconsin, Wisconsin Department of Natural Resources, accessed September 24, 2014, at http://dnr.wi.gov/topic/mines/documents/silicasandminingfinal.pdf.
- Wolfe, M.E., 2013, 2012 report on Ohio Mineral Industries : An annual summary of the State’s economic geology, State of Ohio, Department of Natural Resources, Division of Geological Survey, accessed September 11, 2014, at http://farmanddairy.lyleprintingandp.netdna-cdn.com/wp-content/uploads/2013/11/MinInd12.pdf.
- Woodbine Acquisition, LLC, 2012, IAA – Private capital conference, accessed October 2, 2014, at http://www.ipaa.org/meetings/ppt/2012PCC/4thPanel_AliAhmed_WoodbineAcquisitionCorp.pdf.
- Yahoo Finance, 2014, Form 10-Q for U.S. Silica Holdings, Inc., accessed October 8, 2014, at http://biz.yahoo.com/e/140430/slca10-q.html.
- Zdunczyk, Mark, 2014, Hydraulic fracturing sand (frac sand): Mining Engineering, v. 66, no. 7, p.53-55.