
By Mark S. Kuhar
A Disappointing Second-Quarter Report From USGS Indicates Decreased Production Levels Versus 2012.
While many economic indicators, including construction spending, construction employment and residential construction are enjoying resurgence; aggregates production has failed to keep up its end of the bargain.
According to the U.S. Geological Survey’s (USGS) quarterly sample survey of aggregates producers, lower stone production characterized the second quarter of the year when compared to last year.
An estimated 555 million metric tons (Mt) of total construction aggregates was produced and shipped for consumption in the United States in the second quarter of 2013, a slight decrease compared with that of the second quarter of 2012.
An estimated 321 Mt of crushed stone was produced and shipped for consumption in the United States in the second quarter of 2013, a slight increase compared with that of the second quarter of 2012.
The estimated U.S. output of construction sand and gravel produced and shipped for consumption in the second quarter of 2013 was 234 Mt, a slight decrease compared with that of the second quarter of 2012.
Estimated portland cement consumption increased slightly in the second quarter of 2013 compared with that of the second quarter of 2012.
The estimated consumption in the first 6 months of 2013 also increased slightly compared with that of the same period of 2012. This information is obtained from the USGS monthly survey of U.S. cement producers.
By Region
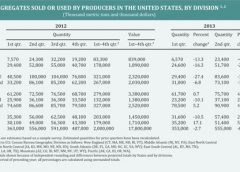
The estimated production-for-consumption of construction aggregates in the second quarter of 2013 increased in five of the nine geographic divisions compared with that sold or used in the second quarter of 2012.
The largest increases in percentages were recorded in the Pacific, West South Central, and the South Atlantic divisions. Production-for-consumption increased in 17 of the 44 states that were estimated.
The five leading states, in descending order of production-for-consumption, were Texas, California, Pennsylvania, Missouri and Ohio. Their combined total production-for-consumption was 168 Mt and represented 30 percent of the U.S. total.
The estimated production-for-consumption of crushed stone in the second quarter of 2013 increased in five of the nine geographic divisions compared with that sold or used in the second quarter of 2012.
The largest increases were recorded in the West South Central, East South Central and the South Atlantic divisions. Production-for-consumption increased in 18 of the 46 states that were estimated.
The five leading states, in descending order of production-for-consumption, were Texas, Pennsylvania, Missouri, Ohio and Florida. Their combined total production-for-consumption was 113 Mt and represented 35 percent of the U.S. total.
The estimated production-for-consumption of construction sand and gravel in the second quarter of 2013 increased in four of the nine geographic divisions compared with that sold or used in the second quarter of 2012.
The largest increases in percentages were recorded in the South Atlantic, the Pacific and the West South Central divisions. Production-for-consumption increased in 20 of the 46 states that were estimated.
The five leading states, in descending order of production-for-consumption, were Texas, California, Michigan, Arizona and Colorado. Their combined total production-for-consumption was 77.3 Mt and represented 33 percent of the U.S. total.
Half-Year Update
The estimated production for consumption of aggregates in the first six months of 2013 was 908 Mt, a slight decrease compared with that of the same period of 2012. In the second half of the year, total aggregates production would have to top 1.78 Mt to beat 2012 second-half totals.
The estimated production for consumption of crushed stone in the first six months of 2013 was 533 Mt, a slight decrease compared with that of the same period of 2012. In the second half of the year, crushed stone production would have to top 618 Mt to beat 2012 second-half
totals.
The estimated production for consumption of sand and gravel in the first six months of 2013 was 375 Mt, a slight decrease compared with that of the same period of 2012. In the second half of the year, construction sand and gravel production would have to top 460 Mt to beat 2012 second-half totals.
State Stats
The five states with the highest percentage increase in total aggregates production in the second quarter of 2013 were:
■ Florida: 36.3 percent.
■ Kentucky: 30.4 percent.
■ Colorado: 23.6 percent.
■ Arizona: 18.9 percent.
■ West Virginia: 14.5 percent.
The five states with the highest percentage decrease in total aggregates production in the second quarter of 2013 were:
■ Wisconsin: -50.8 percent.
■ South Dakota: -44.2 percent
■ Nebraska: -31.9 percent.
■ Minnesota: -25.2 percent.
■ Nevada: -22.9 percent.
Looking Ahead
An estimated 580 Mt of total construction aggregates was produced and shipped for consumption in the United States in the third quarter of 2012. That is the number that the industry will have to beat for USGS to report an increase in production.
The estimated production-for-consumption of aggregates in the third quarter of 2012 decreased in seven of the nine geographic divisions compared with that sold or used in the third quarter of 2011. The largest decreases in percentages were recorded in the East South Central (19 percent), the Middle Atlantic (18 percent), and the East North Central (10 percent) divisions.
These regions will have to improve aggregates production to avoid a repeat of last year’s third-quarter production decreases.
Disclaimer
This sample survey generates production-for-consumption estimates by quarters, based on information reported voluntarily by a limited number of producing companies. In most quarters, a few companies may report amounts sold in the current quarter that vary greatly from the amounts reported in the previous year during the same quarter.
This change in sales is almost never an indicator of the change in the demand in the state as a whole. The usual cause behind a large change can be attributed to the opening or closing of an operation, weather, or an external force that only the company or one of its operations experienced in that quarter.
Previously reported data are occasionally revised, and the estimated quantities for the prior quarters are then U.S. Department of the Interior U.S. Geological Survey recalculated.
The latest release of the quarterly Mineral Industry Surveys contains the most recent estimated totals and supersedes previously published reports.
