
In This Exclusive Analysis Prepared For Rock Products, Headwaters MB Looks At Current Market Trends Such As Public Valuation, Mergers And Acquisitions and Aggregates Production.
By Brian Krehbiel
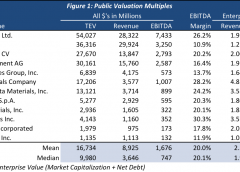
In Q4 2016, there was a number of interesting developments. Figure 1 includes the constituents of Headwaters Aggregates Materials Index as of 12/31/2016.
| Source: FactSet |
Public Valuation Commentary
• Average EBITDA margins were flat from the prior quarter but average EBITDA multiples increased from 11.1x to 12.3x. EBITDA multiple expansion as a percentage was largest for U.S. Concrete (8.6x → 10.9x) followed by Headwaters Incorporated (11.4x → 14.3x) and Eagle Materials (11.8x → 13.8x).
• November 20, 2016 – The Australian Company, Boral Limited, announced that it would acquire Headwaters Incorporated for $24.25 per share, a 21.0 percent premium to Headwaters’ closing stock price at the time of the offer. Headwaters’ stock price increased 39.0 percent during Q4 2016.
Aggregates Performance
2016 Total Returns (Figure 2):

• Aggregate Materials Index – 54.2%
• S&P 500 – 12.0%
• Dow Jones Industrial Average – 13.4%
Trump’s election and the resulting shock to financial markets sent aggregates and other construction related stocks up substantially in late 2016.
2017 YTD Total Returns (Figure 3):

• Aggregate Materials Index – (2.0 percent).
• S&P 500 – 6.2 percent.
• Dow Jones Industrial Average – 5.4 percent.
In 2017, aggregates stocks continued to climb briefly before a February correction surrendered a portion of the gains achieved in 2016. The decline is partially due to disappointment from news that Trump’s infrastructure plans may be pushed back until 2018.
Select Merger and Acquisition Activity
Acquisition activity rebounded in Q4 2016 after a slow Q3 (Figure 4) and the number of transactions completed (32) in the U.S. and Canada was consistent with Q4 2015. Glass transactions were common during the quarter and included the sale of Guardian Industries to Koch Industries and the sale of J.E. Berkowitz to Consolidated Glass Holdings, a holding company of Grey Mountain Partners.
|
Figure 4: Q4 Industry M&A Activity |
|||
|
Transaction Date |
Target/Issuer |
Buyers/Investors |
Transaction Value ($mm) |
|
01/05/2017 |
Everist Materials LLC |
Summit Materials, Inc. |
Undisclosed |
|
12/23/2016 |
Consolis Service Co SA NV |
Bain Capital Private Equity, LP |
Undisclosed |
|
12/21/2016 |
ForzaStone LLC |
Home Brands Group LLC |
Undisclosed |
|
12/19/2016 (Announced) |
Pittsburgh Glass Works LLC /OEM Glass Manufacturing Bus/ |
Vitro SAB de CV |
310.0 |
|
12/07/2016 |
Anchor Glass Container Corp. |
CVC Capital Partners Ltd.; BA Glass BV; Ocelot Acquisition, Inc. |
1,000.0 |
|
12/02/2016 (Announced) |
Cemex Concretos SA de CV /Concrete Pumping Assets/ |
Pumping Team SLL |
109.0 |
|
12/01/2016 (Announced) |
Xella International GmbH |
Lone Star Funds |
Undisclosed |
|
12/01/2016 |
Giant Cement Holding, Inc. (Acquired 55% stake) |
Elementia SAB de CV |
220.0 |
|
11/30/2016 |
Plant and Eight Terminals in U.S. from Lehigh Hanson, Inc. and Essroc Corp., subsidiaries of HeidelbergCement |
Argos USA Corporation |
660.0 |
|
11/28/2016 |
Top Master, Inc. |
O2 Investment Partners; Tecum Capital Management; Oakland Standard Co.; Clio Holdings |
Undisclosed |
|
11/28/2016 (Announced) |
CEMEX SAB de CV /Reinforced Concrete Pipe Unit |
Quikrete Holdings, Inc. |
540.0 |
|
11/21/2016 (Announced) |
Guardian Industries Corp. (Acquired 55.5% stake) |
Koch Industries, Inc. |
Undisclosed |
|
11/20/2016 (Announced) |
Headwaters Incorporated (NYSE:HW) |
Boral Industries, Inc. |
2,629.7 |
|
11/18/2016 |
CEMEX, S.A.B. de C.V., Certain assets in U.S. |
Grupo Cementos de Chihuahua, S.A.B. de C.V. |
306.0 |
|
11/02/2016 |
J.E. Berkowitz, LP |
Consolidated Glass Holdings, Inc. |
Undisclosed |
|
11/01/2016 |
Brock White Co. LLC |
The Sterling Group LP |
Undisclosed |
|
10/14/2016 |
J&G Concrete Operations, LLC |
Hanson Pipe & Precast LLC |
32.0 |
|
10/13/2016 |
RBC Tile & Stone, LLC |
Virginia Tile Company |
Undisclosed |
|
10/04/2016 |
ESSROC Canada, Inc. |
Lehigh Hanson Materials Limited |
281.9 |
|
Sources: S&P Capital IQ and FactSet |
|||
Private Equity Transaction Activity and Valuations
GF Data Resources, a provider of detailed information on business transactions ranging in size from $10 million to $250 million, provides quarterly data from over 200 private equity firm contributors on the number of completed transactions. Figure 5 provides the number of completed transactions from GF Data contributors, the average EBITDA multiple and the average amount of debt utilized in the transaction computed as a multiple of EBITDA. The data, although not industry specific, shows valuations consistent with prior periods but debt levels have declined.
|
Figure 5: Private Equity Valuations & Leverage |
|||||||||
|
All Transactions |
Q1 2015 |
Q2 2015 |
Q3 2015 |
Q4 2015 |
Q1 2016 |
Q2 2016 |
Q3 2016 |
Q4 2016 |
|
|
# of Transactions |
68 |
54 |
45 |
68 |
49 |
74 |
34 |
52 |
|
|
TEV/EBITDA |
6.9x |
6.3x |
7.0x |
6.6x |
6.6x |
7.2x |
6.7x |
6.9x |
|
|
Total Debt/EBITDA |
3.9x |
3.9x |
4.0x |
3.9x |
4.0x |
4.0x |
3.8x |
3.6x |
|
|
Senior Debt/EBITDA |
3.3x |
2.9x |
3.1x |
2.7x |
2.8x |
3.3x |
3.2x |
2.9x |
|
|
Source: GF Data Resources |
|||||||||
Industry Spotlight
 A November 2016 report by TRIP, a nonprofit research organization that distributes economic and technical data on highway transportation issues, highlighted the expanding need for infrastructure repair in the U.S.
Nearly one-third of the nation’s major urban roadways – highways and major streets that are the main routes for commuters and commerce – are in poor condition. These critical links in the nation’s transportation system carry 70 percent of the approximately 3.1 trillion miles driven annually in America.
The report also states an additional 39 percent of the nation’s major urban roads and highways have pavement that is in mediocre or fair condition, and only 28 percent are in good condition.
Company Spotlight
International and domestic aggregates providers experienced positive results in revenue and margins in Q4 2016.
 Vulcan Materials recently reported Q4 2016 financial results. During the quarter, total revenue increased 2.0 percent and on a full-year basis revenue growth was 5.0 percent. Adjusted EBITDA was down 6.0 percent for the quarter but increased by 16.0 percent for the full year as compared to 2015. In Q4, Vulcan signed purchase agreements for four acquisitions that include both aggregates and asphalt assets. Since 2013, the Company has completed 15 transactions that position it to further strengthen its customer service capabilities and cash flows.
 Martin Marietta recently reported record results for Q4 2016 and full-year 2016. The quarterly press release stated, “We are highly confident that a durable, multi-year construction recovery is now underway, consistent with third-party forecasts……..We are encouraged by the emerging bipartisan dialogue in Washington regarding the need for substantial investment in our nation’s infrastructure.” Aggregate product line volume grew by 1.5 percent while product line pricing grew by 7.0 percent and, together with disciplined cost control, gross profit increased by 26.0 percent for the year. For the full-year 2016, revenue and EBITDA grew by 9.4 percent and 29.4 percent, respectively.
Transaction Spotlight

![]() Boral Limited, an international building and construction materials group headquartered in Sydney, Australia, entered into a definitive agreement to acquire Headwaters Incorporated for $1.9 billion in cash on November 20, 2016. The acquisition will double Boral’s presence in the U.S. at a time when infrastructure spending is expected to increase. Boral manufactures and supplies bricks, stone, roofing, concrete, fly ash, gypsum and other building materials. Headwaters’ portfolio of building products consists of specialty siding, trim board, decking, architectural stone, roofing, windows, block products and fly ash. The transaction will be funded by a $1.5 billion share issue, as well as $835 million in borrowing and $364 million in existing cash.
Boral Limited, an international building and construction materials group headquartered in Sydney, Australia, entered into a definitive agreement to acquire Headwaters Incorporated for $1.9 billion in cash on November 20, 2016. The acquisition will double Boral’s presence in the U.S. at a time when infrastructure spending is expected to increase. Boral manufactures and supplies bricks, stone, roofing, concrete, fly ash, gypsum and other building materials. Headwaters’ portfolio of building products consists of specialty siding, trim board, decking, architectural stone, roofing, windows, block products and fly ash. The transaction will be funded by a $1.5 billion share issue, as well as $835 million in borrowing and $364 million in existing cash.
Construction Materials
Construction input prices recovered slightly in December after a steep decline in November, according to a recent analysis of U.S. Bureau of Labor Statistics data released by Associated Builders and Contractors. Input prices rose 0.4 percent for December and are 2.1 percent higher year-over-year, the largest 12-month increase in nearly three years.
Nonresidential input prices as a whole experienced a slightly larger increase, due in part to surging iron and steel prices, rising 0.6 percent for the month and 2.2 percent on the year. Though a number of input categories have experienced increases in prices in recent months, the overall price gains are largely attributable to energy prices.
Aggregates Materials
Industry results in Q4 2016 showed quarterly decreases in volume compared to the same period in 2015 for crushed stone and sand & gravel while cement volume was flat. On an annual basis, crushed stone, sand & gravel and cement volume each increased. Asphalt prices continued to decline in Q4 but should begin to stabilize and reverse the trend going forward following the rebound of oil prices.
Cement

• Portland cement consumption (20.4 million metric tons) decreased by 1.7 percent in Q4 2016 compared to Q4 2015.
• 2016 total portland cement consumption finished up 1.0 percent compared to the prior year.
Ready-Mix Concrete (RMC)

• RMC prices declined 0.6 percent in Q4 2016 but were up 3.1 percent when compared to Q4 2015. Price data is computed from the average RMC net selling prices of U.S. Concrete, Vulcan Materials, Martin Marietta and Eagle Materials.
• RMC production is estimated to have increased 3.0 percent year-over-year in 2016 to 340 million cubic yards.
Crushed Stone

• An estimated 1.37 billion metric tons of crushed stone was produced and shipped for consumption in the U.S. in 2016.
• Crushed stone production in Q4 2016 decreased 4.4 percent compared to Q4 2015.
• Average pricing rose 3.9 percent in 2016 to $11.00 per metric ton.
Sand & Gravel

• Construction sand & gravel valued at $8.6 billion was produced by an estimated 4,100 companies in 2016.
• Sand & gravel production in Q4 2016 decreased 2.6 percent compared to Q4 2015 and on an annual basis increased 2.3 percent from 2015.
• The leading producing states in order of decreasing tonnage were CA, TX, MI, MN, WA, UT, CO, AZ, NY and OH, accounting for 55.0 percent of total output.
Asphalt
• Asphalt prices declined 4.3 percent during Q4 as measured by the average net asphalt selling prices of Vulcan Materials and Martin Marietta.
• Asphalt volume is estimated to have increased 6.0 percent to over 350 million metric tons in 2016.
Construction Aggregates
• Construction aggregates demand has risen 18.4 percent from the recession bottom in 2010.
• Demand remains 25.4 percent below the peak of 3.1 billion metric tons reached in 2006.
• Totals in the chart below are the combined totals of crushed stone and construction sand and gravel production.

Headwaters MB is an independent, middle market investment banking firm providing strategic merger and acquisition advice, capital raising and special situations advisory. Named “Investment Bank of the Year” by major industry organizations for its third consecutive year, Headwaters MB is headquartered in Denver, CO, with seven regional offices across the United States and partnerships with 18 firms covering 30 countries. For more information, visit www.headwatersmb.com. To discuss any information contained in this report, contact the Headwaters MB team: Darin Good, managing director, [email protected], 303-549-5674; Brian Krehbiel, vice president, [email protected], 303-531-5008.