
Rock Products’ Annual Survey On the Opinions, Concerns and Buying Intentions of Producers Reveals What is On The Industry’s Collective Mind.
By Mark S. Kuhar
With the passage of the FAST act, and the realization that transportation funding is written in stone for the next five years, aggregates producers are looking ahead to the 2016 production season. Aggregates production rose in 2015, and 2016 is looking strongly like another year of increases.
In 2015, 1.32 billion metric tons of crushed stone valued at more than $13.8 billion was produced by 1,430 companies operating 3,700 quarries, 82 underground mines, and 187 sales/distribution yards in 50 states, according to the U.S. Geological Survey’s Mineral Commodity Summaries 2016 report. That estimated production volume represents about a 6 percent increase over 2014 total production.
Sand and gravel output for 2015 increased by about 3 percent to approximately 930 million metric tons compared with that of 2014. Construction sand and gravel valued at $7.2 billion was produced by an estimated 4,100 companies and government agencies from about 6,300 operations in 50 states.
This month, we share the results of our third annual, exclusive Rock Products survey, Benchmark 2016. This survey not only offers the opportunity to gauge current producer opinion, we can also compare to last year and see what is the same and what is different.
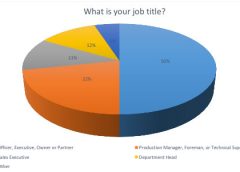
So who took the survey this year? A typical survey respondent was, on average, a company officer, executive, owner or partner (50.8 percent) or a production manager, foreman or technical superintendent (22.03 percent) representing an operation cranking out more than 2.5 million tpy (40.6 percent). Other respondents participating in the survey came largely from, in descending order, operations of less than 500,000 tpy (28.8 percent) and operations of 500,000-1 million tpy (16.9 percent).
A large majority of the survey participants were producers of both crushed stone, and sand and gravel (62.7 percent), while 16.9 percent produced crushed stone exclusively. More respondents this year were dual producers of crushed stone and sand and gravel versus last year (42 percent.) Geographic location was dominated by the Midwest and Northeast, with additional strong response coming from the Southwest.
 Big Issues
When it comes to the key issues facing aggregates producers, the big “number-one” identified by survey participants this year represents a marked departure from last year, when the construction economy topped the list. This year, environmental regulations is number-one at 47.4 percent, followed by the construction economy (45.7 percent) and transportation funding (40.6 percent). Permitting and safety regulations also ranked high.
Here are the top 10 main concerns of aggregates producers who took our survey. Making a jump this year was labor concerns, which is no surprise. Companies plan to ramp up production and they will be looking to fill positions with qualified employees.
- Environmental Regulations
- Construction Economy.
- Transportation Funding.
- Permitting; Safety Regulations (tie).
- National Economy.
- Labor.
- Healthcare.
- Transportation.
- Energy Costs.
- Credit.
Impacting the Industry
 |
 |
Respondents were asked the question “What will impact the U.S. aggregates industry the most in the near future?” One respondent told us, “Now that we have a five-year highway program, our most pressing federal issues are regulatory in nature.”
Another said, “Regulations from urban sprawl, global warming fears, safety regulations, etc.” One respondent added, “Permitting. Improve community communications and address environmental issues during planning, prior to presentations.”
Permitting indeed was a major factor on the minds of some respondents. “With the Federal Highway Bill being passed the added dollars flowing into the states we operate in will generate a greater need for AASHTO #8s and micro-surface materials,” one person said. “Increased capacity and resources will be necessary rapidly so the best place to focus would be to trim the amount of time needed for permitting.”
One respondent noted that an impact to their operation included “limited access to reserves through restrictions on permitting and neighbor issues. We need to be proactive while working with governments and neighbors.”
When asked the question “What limits your access to reserves,” producers noted permitting as the main reason. They also blamed NIMBY Groups, access to materials and a limited quality of existing materials.
The upcoming presidential election was noted by several respondents as something that will impact the U.S. aggregates industry in the near future. Also noted was the impact of low crude oil prices, which had at least one respondent fearing that “Low crude oil prices will slow all aspects of aggregate industry.”
But at least one respondent was asking what happens if demand goes even higher than anticipated. “Federal and state transportation funding beyond existing levels could have a dramatic impact on aggregate demand,” he noted.
Equipment Capitalization
With an AGG1 and MINExpo buying opportunity this year, producers plan to spend some money. Approximately 30 percent of the survey group planned to spend $1-5 million this year, that is up from 21.2 percent last year. Just under 30 percent (28.8 percent) of the survey group plans to spend less than $500,000. But a healthy 22 percent planned to spend $500,000-$1 million.
And what do they plan to buy?
The big winner is equipment upgrades, identified by 69.5 percent of respondents, up from 63.6 percent last year; while 64.4 percent are focused on new equipment, up from 57.9 percent last year. Fewer producers are looking for a used option this year though: 28.4 percent said they planned to consider used equipment in 2015; only 20.3 percent said this year they plan to explore that route.
Other types of equipment on the “want” list are plant additions (38.9 percent), technology upgrades (35.5 percent), mine development (23.7 percent) and, of special interest: 27.1 percent of those surveyed plan to invest in new plants, up from 17 percent in 2015.
 Over and above consumables, such as oil, tires and replacement parts, the top equipment areas being considered for 2016 are:
- Material handling/conveying equipment.
- Screening and sizing equipment.
- Portable crushing/screening plants.
- Excavators/loaders/dredges.
- Drilling and blasting suppliers/services.
- Pick-up/utility vehicles.
- Washing and classifying equipment.
- Crushers.
- Motors.
- Automation products.
- Scales.
- Haul trucks.
- Breakers.
- Energy management.
- Frac sand equipment.
Looking Ahead
When asked to describe the attitude in the aggregate industry in 2016, the answer is clear. Producers are feeling good about their prospects going forward, with a strong 49.1 percent defining themselves as “more optimistic” than in years previous. That tracks closely with the number of respondents who expect aggregates production to increase this year: 50.8 percent.
Statistics based on information gathered by more than 400 respondents who accessed survey.