
By Mary Ellen Benson and Anna Burack Wilson, U.S. Geological Survey, Denver, Colorado
ABSTRACT
The past decade has seen a surge in mineral industry activity targeting the highly pure silica sand deposits of the upper Midwest of the United States for use as frac sand in hydraulic fracturing of unconventional petroleum reservoirs. This frac sand mining boom has resulted from the technological advances in the recovery of petroleum from tight reservoirs that have promoted expansion of hydraulic fracturing and horizontal drilling, all of which are driven by the increasing global demand for energy.
Frac sand is a specialized sand that is added to fracking fluids that are injected into unconventional oil and gas wells during hydraulic fracturing (fracking or hydrofracking), a process that enhances petroleum extraction from tight (low permeability) reservoirs. Frac sand consists of natural sand grains, having strict mineralogical and textural properties, that act as a proppant (keeping induced fractures open), which extends the time of release and the flow-rate of hydrocarbons from the fractured rock surfaces in contact with the well-bore. Although the hydrofracking process is applied in many types of tight reservoirs, the majority of fracking in North America is conducted in shale gas plays. Due to the cost of transportation, the proximity of frac sand source rocks to productive basins is a key consideration in determining the feasibility of mine development.
Highly prized frac sand mined principally in Wisconsin and Minnesota is referred to by the mining industry as “Northern White” sand or “Ottawa” sand. Slightly lower quality frac sand, referred to as “Brady” or “Brown” sand, is mined from central Texas. The principal sources of “Northern White” or “Ottawa” sand in the upper Midwest are the Middle and Upper Ordovician St. Peter Sandstone and the Upper Cambrian and Lower Ordovician Jordan Formation, with the Upper Cambrian Wonewoc and Mount Simon Formations gaining in importance. The main source for the “Brown” or “Brady” sand is the Upper Cambrian Hickory Member of the Riley Formation in central Texas. Additional secondary frac sand sources include the Middle Ordovician Oil Creek Formation in Oklahoma. Sand deposits that are less suitable as frac sand, such as the Pliocene Bidahochi Formation in Arizona and the modern Loup River sands of Nebraska, are also being used in the proppant industry. As the demand for frac sand increases, new sources are being sought that may become economic with changes in technology and physical standards, despite their currently lower quality.
In addition to the abrupt rise in frac sand mining and distribution, a new industry has emerged from the production of alternative proppants, such as coated sand and synthetic beads. Alternative proppants, developed through new technologies, are often more costly than frac sand, but can be more cost-effective because they have better performance in deep wells under high pressure conditions.
INTRODUCTION
Frac sand (“raw frac sand”) is an industrial mineral commodity that consists of a naturally occurring, highly pure silica sand that is used as a proppant during hydraulic fracturing of unconventional oil and gas reservoirs to maximize and extend well production (Beckwith, 2011). A proppant is a granular material that is added to the fracking fluid to prop open the fractured formation to promote the economic flow (conductivity) of hydrocarbons during a well’s productive life (Beckwith, 2011). Unconventional reservoirs are reservoirs with low permeability (are “tight”) to the flow of hydrocarbons. Such reservoirs may include tight sandstones, shales and carbonates, or coalbed methane reservoirs that cannot be produced at economic flow rates or cannot recover economic volumes of gas unless the well is stimulated by a large hydraulic fracture treatment and (or) is produced using horizontal wellbores (Oil and Gas Journal, 2014). The current hydraulic fracture treatment process involves multi-stage fracturing of up to a few dozen stages, allowing for a large number of fractures to be created at specific locations within a single wellbore (Rock Products, 2014c). Such treatment requires large quantities of frac sand for each well in a productive play, with the average 10,000-ft. horizontal well in 2010 using as much as 2,500 tons (2,268 metric tons) (Geiver, 2014).
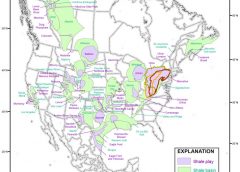
The recent meteoric rise in the demand for frac sand has paralleled the upward trend of horizontal drilling and hydrofracking employed by the petroleum industry as it responds to growth in the global energy market, especially the demand for environmentally cleaner-burning natural gas. While the principal source for frac sand is the traditional glass sands of the Midwest that are primarily pure silica, the high silica content is but one of the necessary criteria. Among the additional specifications are requirements for high sphericity/roundness, a uniformly medium- to coarse-grain size, high crush resistance, low solubility, low turbidity, and good friability. Additional factors that influence the economics of frac sand mining are the deposit’s accessibility at or near the surface, areal extent and thickness, textural uniformity, nearness to trucking and rail transportation routes, and proximity to the active unconventional petroleum basins (Figure 1).
|
|
| Figure 1. Map of shale plays and basins in North America. (Modified from U.S. Energy Information Administration, 2011; and Kuuskraa and others, 2011.) Shale plays that overlap are distinguished by colored borders: Marcellus (red), Ohio-Devonian (orange), and Utica (olive green). |
The principal stratigraphic units that are mined for premium frac sand (“Northern White” and “Ottawa”) are in the Midwest and include the Middle and Upper Ordovician St. Peter Sandstone, the Upper Cambrian and Lower Ordovician Jordan Formation, and the Upper Cambrian Wonewoc and Mount Simon Formations. Sandstone units that meet some, but not all the specifications (“Brady” or “Brown”) are from the Upper Cambrian Hickory Sandstone Member of the Riley Formation in central Texas. Less economic deposits of the Middle Ordovician Oil Creek Formation of the Simpson Group in Oklahoma (a partial St. Peter Sandstone equivalent) are also used in the frac sand industry.
The effort to meet the growing demand for hydrocarbon industry proppants that meet the requirements of increasingly deeper wells has fostered the development of a new industry in alternative proppants. These alternative proppants include resin-coated sand and synthetic proppants engineered from high-strength ceramic materials such as sintered bauxite (Dolley, 2012). The highly sophisticated proppants of today result in increasingly optimal results in hydrocarbon recovery as proppants can be customized for each particular reservoir, well, or treatment design.
This frac sand report begins with a description of the unique physical properties of frac sand, then focuses on the geology and the spatial relationships of frac sand sources in the United States. It tracks recent published efforts to examine the potential for less conventional frac sand sources, reviews the current and future competing sources in Canada, and discusses the emergence of alternative proppants and their role in the market. Furthermore, it summarizes the processes of origin for frac sand deposits, and provides geologic guidelines to assist in the search to identify potential new sources of frac sand. This report contains information and map figures excerpted from a U.S. Geological Survey Open-File Report that is currently in press. (Benson, M.E., and Wilson, A.B., Frac Sand in the United States—A Geological and Industry Overview), which relies upon digital data from the U.S. Geological Survey State Geology Map Compilation Geodatabase of the Conterminous United States (SGMC) that is in preparation (J.D. Horton, C.A. San Juan, and D.B. Stoeser, unpub. data). Whenever units of measurement are provided in this report, the first value given is in units as published in the referenced citation; and where converted to other units, these values are shown subsequently in parentheses. The goals of this compilation are to provide basic information about the geologic units that are currently yielding high- and medium-quality frac sand and substrate (seed) sand best suited for resin coating, and to recognize for future examination some of the additional sources that have limited suitability. The intent of this report and the maps included is to convey information about frac sand as a resource; and to graphically illustrate the geographic distribution of geologic units that contain major current and potential future frac sand sources in the United States.
OPTIMAL PHYSICAL PROPERTIES FOR FRAC SAND
The specifications for frac sand are based upon the standards for proppants determined by the American Petroleum Institute (API) and the International Organization for Standards (ISO) (American Petroleum Institute and others, 2008). These frac sand standards were modeled after the properties of the “Ottawa” or “Northern White” sand (Figure 2) and the “Brady” or “Brown” sand (Zdunczyk, 2014). The “Ottawa” sand, a synonym for the St. Peter Sandstone mined from Ottawa, Illinois (Maslowski, 2012), is used as a standard by the American Society of Testing Materials (ASTM) (Zdunczyk, 2014). The frac sand specifications include criteria for mineralogy (high percent silica content), grain size range from medium to coarse, sphericity/roundness of 0.6 or greater, high crush resistance, low solubility, low turbidity, and good friability (American Petroleum Institute and others, 2008).

|
| Figure 2. A magnified sample of “Northern White” sand showing well-rounded grains. (Photo courtesy of Fairmount Santrol). |
High Silica Content
The premium frac sand is >99 percent quartz or silica (SiO2) (Zdunczyk, 2007, 2014), although a great deal of sand used as frac sand falls within the range of 95-99 percent silica content. Mineralogical purity as to silica content is a characteristic of mature and super-mature sand or sandstone, which has been highly reworked and well sorted, so that mechanically and chemically less-resistant minerals and fine particles have been dissolved or winnowed away (Pettijohn and others, 1972).
Grain Size
Generally, a range of grain sizes from 0.1 to >2 millimeters (mm) diameter is desirable. Size is based on “U.S. Standard Sieve Series sizes” or “U.S. Mesh,” in which the smaller the grain-size number, the coarser the grain (Beckwith, 2011). Grain size ranges for sand samples are designated by notations such as 20/40, 30/50, 40/70, and so forth, that indicate the end-member mesh sizes for >90 percent of the sample. In the case of 20/40 sand, >90 percent of the sand passes through the 20 mesh (0.850 mm) sieve and is retained by the 40 mesh (0.425 mm) sieve (Zdunczyk, 2014).
Larger sand grains provide better permeability, but smaller sand grains are typically stronger (Rupke, 2014). Grain size requirements for frac sand are determined by downhole conditions and completion design, but 20/40 has been the most in demand (Montgomery and Smith, 2010; Beckwith, 2011). Typically, 20/40 and 30/50 are most popular for oil fracking; and 40/70 and 70/140 are most commonly used for gas fracking (Zdunczyk, 2014). The use of 40/70 and the finer 100 mesh sands has increased in response to growth in gas development in the Barnett, Fayetteville, Haynesville, and Marcellus shale plays (Beckwith, 2011).
High Sphericity/Roundness
Shape factors are based upon the Krumbein/Sloss criteria for sphericity and roundness (Krumbein and Sloss, 1963), with the ISO 13503-2/API RP19C standards for frac sand at ≥0.6 for each. The greater roundness/sphericity provides better porosity/permeability between grains, allowing better flow of oil and gas from the fractures to the wellhead (Zdunczyk, 2014).
High Crush Resistance
Crush resistance testing for proppants is measured in weight percent (wt. %) of fines generated under specific loading pressures up to 9,000 pounds per square inch (psi), and it varies for each grain size (mesh) range. For example, at 4,000 psi, the 6/12 mesh should yield ≤20 wt. % fines; 16/30 mesh and 20/40 mesh should yield ≤14 wt. % fines; 30/50 mesh should yield ≤10 wt. % fines; and 40/70 mesh should yield ≤6 wt. % fines (Zdunczyk, 2007). The pressure test results in a k-value that indicates the highest value of psi pressure X 1,000 that generates ≤10 wt. % fines (American Petroleum Institute and others, 2008). For example, a k-value of 8 means that, at 8,000 psi pressure, no more than 10 wt. % fines were generated, but more than 10 wt. % fines were generated at the next higher tested pressure.
Different types of frac sand can bear different ranges of crush resistance (stress ranges) and are assigned classes recognized by API that reflect this. Class C sands (such as modern aeolian sands) have a stress range of 0–4,000 psi, Class D sands (such as the Hickory Sandstone Member of the Riley Formation) have a stress range of 0–5,000 psi, and Class E sands (such as the St. Peter Sandstone) have a stress range of 2,000–6,000 psi (Herron, 2006). Modified and synthetic proppants have higher stress ranges than frac sand; resin-coated proppants will bear 4,000–12,000 psi, and ceramic proppants will bear 10,000–16,000 psi of stress loading (Herron, 2006).
Crush resistance of frac sand is dependent upon hardness of grain; grain crystallinity; absence of weak planes that could have developed during tectonism; absence of deep pitting of grains, and absence of authigenic overgrowths on quartz grains (Zdunczyk, 2007). To reduce the presence of weaker grains, the ISO 13503-2 proppants standard for percent clusters is ≤1.0.
Low Solubility
Acid solubility of a sandstone is determined by the amount of soluble cement or soluble mineral grains that it contains. Low solubility requires a high percent silica, as quartz tends to be insoluble under ordinary conditions, becoming increasingly soluble when the pH exceeds nine, or when exposed to hydrofluoric acid (Missouri Department of Natural Resources, 2014). Frac sand solubility is measured by percent weight loss from a test in which a 5-gram sample of proppant is soaked in a 12/3 mixture of HCl/HF for 0.5 hr at 150°F, after which the sample is rinsed, dried, and reweighed (American Petroleum Institute and others, 2008). The ISO 13503-2/API RP19C solubility standard for proppants varies according to grain size ranges; 6/12 through 30/50 is <2.0 percent weight loss, and 40/70 through 70/140 is <3.0 percent weight loss.
Low Turbidity
Low turbidity is defined as the absence of clay, silt, or other fine grains and impurities. The amount of suspended particles or other finely divided matter is measured in scattered light in a formazin-based solution at 90° angles, and is recorded in Nephelometric Turbidity Units (NTU) or Formazin Turbidity Units (FTU). (optek-Danulat, Inc., 2014). The ISO 13503-2 turbidity standard for frac sand is ≤250 NTU.
Low turbidity is a result of mineralogical maturity and grain-size sorting in the natural depositional environment. Fine suspended matter in the mined sand is usually washed out during processing, so this property can be controlled for the final product (Zdunczyk, 2007; O’Driscoll, 2012; Buchsbaum, 2013).
Density/Specific Gravity
Bulk density is the density of both the proppant and the porosity, and it is measured by filling a known volume with dry proppant and measuring the weight. Apparent density excludes the extra-granular porosity by placing a known mass in a volume of fluid and determining the amount of fluid that is displaced. Absolute density is the density that the material would have if no intra-granular porosity were present (American Petroleum Institute and others, 2008).
Specific gravity of liquids and solids is defined as a dimensionless unit which is the ratio of density of a material to the density of water at a given temperature. Specific gravity of quartz is 2.65 (Hurlbut, 1971).
The standard, ISO 13503-2, describes how density is measured, but gives no requirement for frac sand. “Bulk density/specific gravity” is listed as an indicator of quartz purity of sand when its value is similar to that of quartz (Wolfe, 2013).
Good Friability
Unconsolidated deposits of “soft, loose” sand or poorly consolidated, poorly cemented (friable) sandstone is most desirable (Runkel and Steenberg, 2012). Such material can be mined without blasting and is removed by large excavators or power shovels (Maslowski, 2012).
GEOLOGICAL DESCRIPTIONS OF CURRENT AND POTENTIAL SOURCES OF FRAC SAND IN THE UNITED STATES
PRINCIPAL SOURCES OF FRAC SAND
Brief Overview
The upper Midwest (north-central midcontinent) of the United States has the principal supply of the premium frac sand that the industry calls “Northern White” or “Ottawa White” sand in near-surface exposures that make it economic to mine. This 99.8 percent pure silica sand brings premium prices and is mined from the Middle and Upper Ordovician St. Peter Sandstone, the Upper Cambrian and Lower Ordovician Jordan Formation, and the Upper Cambrian Wonewoc and Mount Simon Formations in Wisconsin, Minnesota, Illinois, and nearby states (Zdunczyk, 2007; Runkel and Steenberg, 2012). These units are widespread sheet sands deposited in the early Paleozoic continental interior seaway, whose lithologic characteristics and stratigraphic relationships are well illustrated in exposures in Sauk County, Wisconsin (Clayton and Attig, 1990). The following discussions of these principal frac sand source units are organized according to order of importance as frac sand sources within geographic regions. Stratigraphic columns are provided to maintain a sense for their correct age and stratigraphic context.
The Middle and Upper Ordovician St. Peter Sandstone (Figure 3) is an areally extensive marine coastal sandstone representing the onset of Sloss’s (1963) Tippecanoe sequence that was deposited on the deeply eroded unconformable surface of the Ordovician Oneota Dolomite of the Prairie du Chien Group that forms the top of the Sauk sequence in Wisconsin (Sloss, 1963; Clayton and Attig, 1990). The underlying Upper Cambrian and Lower Ordovician Jordan Formation and Upper Cambrian Wonewoc and Mount Simon Formations are among the widespread marine sands of the earlier phases of the Sauk sequence deposited on the unconformable Precambrian surface of the North American Craton (Clayton and Attig, 1990) (Figure 3).
 |
| Figure 3. Geologic column showing the lithostratigraphic units in Sauk County, Wisconsin. (No scale is implied.) (Modified from Clayton and Attig, 1990.) |
In central Texas, deposits mined for frac sand are referred to as “Brown” or “Brady” sand. These are local quartz arenites that are within the subarkosic to arkosic Upper Cambrian Hickory Sandstone Member of the Riley Formation in the Llano uplift region (Kyle and McBride, 2014) (Figure 4).
 |
| Figure 4. Stratigraphic column of the Cambrian units of the Llano uplift of central Texas featuring the Upper Cambrian Hickory Sandstone Member of the Riley Formation that unconformably overlies the Proterozoic basement. (Modified from Kyle and McBride, 2014; modified after Barnes and Bell, 1977). |
Oklahoma’s principal mined source of frac sand is the basal sand member of the Middle Ordovician Oil Creek Formation of the Simpson Group (Figure 5) that crops out in south-central Oklahoma (Suhm and Ethington, 1975). This sand unit is referred to as the Connell Sandstone Member in west Texas. The Oil Creek Formation and its equivalents have characteristics similar to the Ordovician St. Peter Sandstone of the Mississippi Valley (Suhm and Ethington, 1975) and are generally considered to be partially stratigraphically equivalent to the St. Peter Sandstone (Dapples, 1955).
 |
| Figure 5. Stratigraphic column of the Ordovician Simpson Group showing subdivisions as in common usage in west Texas and Oklahoma. (No scale is implied.) (Modified from Suhm and Ethington, 1975.) |
The six principal frac sand source units are subsequently described as to their petrology, stratigraphy, areal extent, and paleoenvironmental characteristics. The units are organized by formation name listed in order of importance as a frac sand source for each region. The list begins with the most important sources of “Northern White” sand of the Midwest, that is, the St. Peter and the Jordan (Maslowski, 2012). These are followed by the Wonewoc and Mount Simon, also of the Midwest; the Hickory “Brown” or “Brady” sand, of importance primarily in Texas; and the Oil Creek, a partial St. Peter equivalent in Oklahoma. Stratigraphic nomenclature conforms to that provided by the references, as cited, except where names of units are modified to conform to U.S. Geological Survey conventions.
Midwest Frac Sand Sources
St. Peter Sandstone
The Middle and Upper Ordovician St. Peter Sandstone and the partly stratigraphically equivalent sandstones of the Simpson Group are widespread in areal extent, both in the surface and subsurface, occurring in southern Wisconsin, Minnesota, Illinois, Iowa, Michigan, Indiana, Kentucky, Missouri, Nebraska, Kansas, Arkansas, Oklahoma (Dake, 1921; Dapples 1955; Cole, 1965; Mai and Dott, 1985; Davis, 2011), west Texas (Suhm and Ethington, 1975; Jones, 2009), and Ohio and Tennessee (Dake, 1921). The present distribution of the uneroded sandstones of the St. Peter and Simpson attests to the widespread original depositional extent that covered much of the mid-continent region (Figure 6).
 |
| Figure 6. Areal extent (surface and subsurface) of the Ordovician St. Peter Sandstone in the upper and central Midwest and partly equivalent units within the Simpson Group in Kansas, Oklahoma, and west Texas. (Modified from Dake, 1921; Dapples, 1955; Cole, 1965; Jones, 2009; Davis, 2011.) |
In the upper Midwest, where the St. Peter Sandstone is unambiguously distinguished, it is in near-surface deposits in parts of western, southwestern, and south-central Wisconsin; southeastern Minnesota; northeastern Iowa; and northern Illinois (Mai and Dott, 1985) (Figure 7). In the central Midwest, surface exposures of the St. Peter Sandstone are limited to a narrow arc-shaped feature extending from central to southeastern Missouri (Davis, 2011) and the highlands of the Ozark Plateau in northern Arkansas (Glick and Frezon, 1953) (Figure 8).
 |
| Figure 7. Surface exposures of frac sand source units in the upper Midwest. Shown are geologic units that contain the Middle and Upper Ordovician St. Peter Sandstone (green) in Wisconsin, Minnesota, Iowa, and Illinois; the Cambrian “undivided” that includes the Upper Cambrian and Lower Ordovician Jordan Formation and the Upper Cambrian Wonewoc and Mount Simon Formations (lavender) in Wisconsin, Minnesota, and Illinois; the Jordan Formation (red) mapped separately in Iowa and Upper Peninsular Michigan; and the Munising Formation (pink) (a partial equivalent of the Wonewoc Formation) mapped in Upper Peninsula Michigan. Along the banks of the Mississippi River in Iowa, thin exposures of the Wonewoc Formation (pink) and the Mount Simon Formation (orange) are mapped. Note that the Wisconsin “driftless area” is outlined in dark green, rivers are dark blue, lakes are light blue, and towns are red dots. |
 |
| Figure 8. Surface exposures of principal frac sand source units in Missouri, Arkansas, and Oklahoma. Frac sand source units shown are the Middle and Upper Ordovician St. Peter Sandstone (green) in Missouri and Arkansas, and the Middle Ordovician Oil Creek Formation (pink) of the Simpson Group—a partial St. Peter equivalent in Oklahoma. Towns appear as red dots. |
Stratigraphically, the St. Peter Sandstone in the northern Midwest is a formation within the Ancell Group (Mudrey and others, 1987). From evidence in outcrops in Sauk County, Wisconsin, the St. Peter Sandstone is subdivided, in descending order, into the Tonti and Readstown Members (Clayton and Attig, 1990) (Figure 3). In this area, the younger Tonti Member makes up most of the St. Peter Sandstone, and consists of very pale brown to yellowish red, fine- to medium-grained, quartzose sand, the coarser grains of which tend to be rounded, but in many places the grains exhibit faceted quartz overgrowths that produce a conspicuously sparkly surface in outcrop (Clayton and Attig, 1990). In outcrop, the sandstone is hard due to silica cement (Clayton and Attig, 1990). The Readstown Member, by contrast, is a breccia of pebbles, cobbles, and boulders of sandstone that resembles that of the overlying Tonti Member (Clayton and Attig, 1990).
In the area from north-central Illinois to southeastern Missouri, the subdivisions of the St. Peter include the fine-grained sands of the Tonti Member as the lower unit and the medium-grained sands of an overlying member known as the Starved Rock Member (Visocky and others, 1985). North of Jefferson County, Missouri, fine- to coarse-grained, pink to reddish-brown sandstone with varying amounts of shale, chert, and dolomite fragments constitute a basal unit that underlies the Tonti Member that is referred to as the Kress Member (Suter and others, 1959). In some parts of the subsurface of northern Missouri, the Kingdom Shale Member separates the Tonti and Starved Rock Members (Missouri Department of Natural Resources, 2014).
The St. Peter Sandstone has been correlated with sandstone as far south and west as the Simpson Group of Oklahoma and west Texas (Suhm and Ethington, 1975), and with outcrops of the Burgen Sandstone of eastern Oklahoma (Buttram, 1913).
From the excellent exposures near Pacific, Missouri (Figure 9), the St. Peter Sandstone has been described as an ultra-pure (>99 wt. % silica in places), well-sorted, friable, fine to medium grained, rounded, highly spherical, and characteristically frosted, quartzose sandstone with an average thickness of 80 to 100 ft. (24 to 30 m) (Missouri Department of Natural Resources, 2014).
 |
| Figure 9. Outcrop of dune facies of St. Peter Sandstone at old mine entrances in Pacific, Missouri. (Image from Kbh3rd at Wikipedia, Public Domain, from Wikimedia Commons.) |
In northwestern Wisconsin, the St. Peter Sandstone is 25 meters (m) (82 ft) thick (Mudrey and others, 1987). Elsewhere, the formation is highly variable in thickness. In Missouri, the St. Peter Sandstone averages 80 to 100 ft. (24 to 30 m) (Missouri Department of Natural Resources, 2014). In most of northern Illinois, its thickness ranges from 100 to 200 ft. (30 to 60 m); however, north of the Sandwich fault zone, a maximum thickness range of 400 to 600 ft. (120 to 180 m) is reached (Visocky and others, 1985). The highly variable thickness is the result of deposition on both erosional channels and karsted surfaces in the underlying carbonate beds (Visocky and others, 1985)
|
||||||||||||||
| Table 1. Properties of St. Peter Sandstone in Missouri. (Missouri Department of Natural Resources, 2014). |
Despite bearing the industry name “Northern White,” the St. Peter can be white to pale yellow, buff to tan, depending upon its iron content (Mudrey and others, 1987). In exposures in Missouri, bedding within the St. Peter Sandstone is indistinct, and the unit often appears massive throughout. Locally, however, the rock may be cross bedded, ripple marked, and is generally porous, permeable, and mostly nonfossiliferous in Missouri (Missouri Department of Natural Resources, 2014). Marine fossils are observed in the unit, however, as far north as Minneapolis, Minnesota (Dake, 1921).
The mineralogic and textural maturity of the St. Peter Sandstone is attributed to multicyclical marine shoreface and coastal aeolian processes acting upon sediment derived from older Cambrian and Precambrian sands (Mazzullo and Ehrlich, 1983; Winfree, 1983; Dott and others, 1986; Dott, 2003). Dake (1921) points to the Upper Cambrian Potsdam Sandstone as a possible provenance for the St. Peter Sandstone.
The unit is not uniformly homogeneous throughout its geographic extent, as depositional facies changes and diagenetic alteration have impacted its mineralogic purity, grain size and shape, and friability. For example, quartz overgrowths are observed in the unit in areas of southwestern and south-central Wisconsin, and in southeastern Minnesota (Kelly, 2006; Kelly and others, 2007; Winfree, 1983; Clayton and Attig, 1990), making the grains less rounded/spherical in places. For these reasons, in the case of the St. Peter Sandstone, as with all the other units discussed in this report, not all surface exposures of the formation shown on the Figure maps and in Plate 1 are suitable for frac sand mining.
Jordan Formation
The Upper Cambrian and Lower Ordovician Jordan Formation is within the Trempealeau Group (Ostrom, 1967) and is a marine regressive sandstone (Runkel, 1994) that crops out in southeastern Minnesota, west-central Wisconsin, and northeastern Iowa (Thomas, 1992). It has also been recognized in Illinois (Clayton and Attig, 1990) and extends into the Upper Peninsula of Michigan where the Jordan is partly equivalent to the Trempealeau, which, at this locality, is of formation rank (Figure 7) (Plate 1). Note that the surface map extent of the Jordan shown on Plate 1 is actually Cambrian “undivided” in Wisconsin and Minnesota. This means that the Jordan is combined with other Upper Cambrian strata that include the Wonewoc and Mount Simon Formations as well as nonsand-bearing units; therefore, each of these Upper Cambrian units is overrepresented on the Figure map and in Plate 1.
Throughout much of Wisconsin, the Jordan Formation contains primarily two quartzose sandstone members (Mudrey and others, 1987; Clayton and Attig, 1990; Runkel, 1994) (Figure 3). The uppermost unit is the Van Oser Member, which is quartzose, white to brown to yellow or orange, fine to medium grained, poorly sorted, medium to thin bedded, cross bedded, with calcite-cemented nodules, is iron cemented in places, may be locally interbedded with the underlying unit, and 9 to 15 m (30 to 50 ft) thick (Mudrey and others, 1987). In extreme western Wisconsin, the Van Oser is known as a medium- to coarse-grained, well-rounded quartz arenite that is thick bedded, contains cross bedding and calcareous concretions, and is easily disaggregated, with a thickness of around 45 ft. (14 m) (Ostrom, 1987). The Van Oser is interpreted as a higher-energy, marine intertidal sand deposited as the sea shallowed (Runkel, 1994). Underlying the Van Oser Member, the Norwalk Member is quartzose, white, fine grained, rounded, moderately sorted, medium bedded, with a trace of garnet, and 15 to 18 m (50 to 60 ft) thick (Mudrey and others, 1987). In extreme western Wisconsin, the Norwalk is a fine- to very fine-grained feldspathic sandstone (Ostrom, 1987; Runkel, 2000). It is interpreted as a low-energy, below wave base, marine deposit (Runkel, 1994).
The Van Oser Member is the more suitable of the Jordan subunits in Wisconsin for use as frac sand, as it is coarser grained and higher in silica than the Norwalk Member (Runkel and Steenberg, 2012; Brown, 2014). The Van Oser is highly prized for its high yield of 20/40 mesh quartz sand (Runkel and Steenberg, 2012). An important consideration when mining the Van Oser sand is the approximately 100-ft (30-m) thick resistant dolomite of the Oneota Dolomite of the Lower Ordovician Prairie du Chien Group that exists as overburden in many places in Wisconsin (Runkel and Steenberg, 2012). For this reason, the Van Oser is preferentially extracted from eroded hilltops in Barron and Chippewa Counties; from old quarries and ridgetops in Dunn, St. Croix, and Buffalo Counties; and from underground mines in Pierce County, Wisconsin (Brown, 2014).
In southeastern Minnesota, the Van Oser Member is interfingered with the Waukon Member (also of the Jordan Formation) and is overlain by the Sunset Point Member of the Jordan (Ostrom, 1987) that is a fine-grained feldspathic and dolomitic shallow-marine deposit (Thomas, 1992) now referred to the Coon Valley Member of the overlying Oneota Dolomite (Clayton and Attig, 1990; Runkel, 1994). Similarly to the subdivisions in Wisconsin, the Van Oser Member in Minnesota is described as a medium-grained quartzose sand; and the Norwalk and Waukon Members are very fine-grained feldspathic sands (Thomas, 1992).
In parts of Minnesota and western Wisconsin, diagenetic processes such as quartz syntaxial and potassium feldspar epitaxial overgrowths, hematite precipitation, dolomitization, calcite precipitation, calcite dissolution, and a second hematite precipitation have variously altered the original texture of the sands of the Jordan Formation (Thomas, 1992; Runkel and Steenberg, 2012). Jordan samples from Arcadia, in Trempealeau County, Wisconsin, show originally rounded quartz grains with second-stage rounding of quartz overgrowths indicative of multi-cycling, and authigenic feldspar overgrowths that result in localized compromises to optimal frac sand properties (Runkel and Steenberg, 2012).
Wonewoc Formation
The Upper Cambrian Wonewoc Formation is the uppermost formation within the Elk Mound Group (Clayton and Attig, 1990) (Figure 3). The formation overlies the Eau Claire Formation, also of the Elk Mound Group. The Wonewoc Formation is observed in Wisconsin, Minnesota, Iowa, and Illinois (Figure 7) (Plate 1); although it is mapped as Cambrian “undivided” in these states but for Iowa, which means it is combined with other Cambrian units, as described above for the Jordan.
Where the Wonewoc Formation crops out in west-central Wisconsin, it consists of two quartzose sandstone members. In descending order, they are the Ironton Member and the Galesville Member (Mudrey and others, 1987; Clayton and Attig, 1990). In northeastern Wisconsin, the narrow outcrop belt of Wonewoc Formation extends northward into the Upper Peninsula of Michigan, where it is known as the Munising Formation (Dott and others, 1986).
In much of Wisconsin, the Ironton Member is quartzose, white to brown with iron staining, medium to coarse grained, subrounded, poorly sorted, wavy bedded, with vertical burrows present, and calcite cemented, and 5 to 18 m (16 to 60 ft) thick (Mudrey and others, 1987). Underlying the Ironton Member, the Galesville Member is quartzose, white, fine to medium grained, rounded to subrounded, well sorted, thick bedded, cross bedded, poorly cemented, and 5 to 18 m (60 ft) thick with individual bedding units 3 to 5 m (10 to 16 ft) thick (Mudrey and others, 1987). Wherever the sandstone of the Galesville is differentiated as a member, it is the prospective frac sand source within the Wonewoc Formation.
Although the Wonewoc Formation is a highly pure silica sand, it is finer in average grain size than the Van Oser Member of the Jordan Formation, so it is relatively less suitable as a frac sand (Brown, 2014). Despite the generally finer grain size, the Wonewoc can be mined for multiple markets that serve non-frac uses for the finer fraction as well as the frac sand market for the smaller proportion of coarser grained fraction (Brown, 2014). The extensive surface exposure of the Wonewoc is encouraging the development of new frac sand mines that target the Wonewoc sand in Trempealeau, Dunn, Buffalo, Jackson, and Monroe Counties, Wisconsin (Brown, 2014). The Chapel Rock Member of the correlative Munising Formation in Upper Peninsula, Michigan, has been considered for use as a potential glass sand because of its >98 percent quartz content (Heinrich, 2001), although it has not been named as a potential source for frac sand.
Mount Simon Formation
The Upper Cambrian Mount Simon Formation of the Elk Mound Group (Figure 3) has been identified in southern Wisconsin, Illinois, Indiana, Kentucky, Ohio, Minnesota, and Iowa (Clayton and Attig, 1990). The formation is observed at the surface in Minnesota, Wisconsin, and Iowa (Figure 7) (Plate 1); but it, too, is mapped as Cambrian “undivided.” From its erosional boundary in northern Wisconsin, the Mount Simon Formation thickens southward to maximums of 2,600 ft. (790 m) in northeastern Illinois and more than 2,000 ft. (610 m) in central and north-central Iowa (Young, 1992). The unit is recognized only in the subsurface of the Michigan Basin (Cottingham, 1990) where it reaches a thickness of more than 1,000 ft. (305 m) along the basin’s western flank (Catacosinos, 1973). The unit is in the subsurface of the Illinois Basin. The Mount Simon Formation is also known in the subsurface of northern Missouri where it grades southward into the Lamotte Sandstone as it emerges along the flanks the Ozark uplift (Young, 1992). The Mount Simon Formation extends into the subsurface as far east as western Ohio where it is described as tan, friable, moderately sorted, rounded, coarse- to very coarse-grained, siliceous quartz arenite with minor heterolithic sandstone-mudstone couplets (rhythmites) and a quartz granule conglomerate (Saeed and Evans, 2012).
In the northwest quadrant of Wisconsin, the Mount Simon Formation contains three informal quartzose sandstone units (Mudrey and others, 1987). The uppermost sandstone is quartzose, feldspar bearing, white to light gray to pale brown, medium to coarse grained, angular, medium bedded, locally lenticular bedded, and at least 52 m (170 ft) thick (Mudrey and others, 1987). Beneath this unit is the second sandstone that is quartzose, pale yellow orange to pale gray orange, very fine grained, thin to medium bedded, angular, limonite cemented, and 38 m (125 ft) thick (Mudrey and others, 1987). This unit is underlain by an 18 m (60 ft) thick, gray to pale orange, silty shale (Mudrey and others, 1987). The basal sandstone unit is quartzose, very pale orange, very fine to fine grained, subangular to subrounded, and at least 35 m (115 ft) thick; but known only in the subsurface in northwestern Wisconsin (Mudrey and others, 1987).
Farther eastward in Wisconsin, the Mount Simon is near the surface in Clark, Wood, and northern Jackson, and Monroe Counties (Brown, 2014). Much of the sandstone of the Mount Simon in this area has been reworked and deposited as alluvial sand that is mined as a byproduct of cranberry bog construction (Brown, 2014).
In the Wisconsin Dells area in Sauk County (south-central Wisconsin), the Mount Simon Formation is generally described as a medium-grained sandstone that also contains considerable amounts of coarse-grained sand and a smaller amount of fine-grained sand, the coarser grains especially having undergone considerable rounding and consisting largely of quartz (Clayton and Attig, 1990).
South-central Frac Sand Sources
Hickory Sandstone Member of the Riley Formation
The Hickory Sandstone is the basal member of the Upper Cambrian Riley Formation of the Moore Hollow Group (Figure 4) of central Texas that was deposited on the unconformable surface of the Proterozoic and crops out along the western flank of the Llano uplift (Kyle and McBride, 2014) (Figure 10) (Plate 1).
 |
| Figure 10. Surface exposures of “Brady” or “Brown” frac sand source units in central Texas and marginal frac sand outcrops in Oklahoma. Shown are the Upper Cambrian Hickory Sandstone Member (light green) of the Riley Formation in the Llano uplift of central Texas, and the Middle Ordovician Oil Creek Formation (pink) of the Simpson Group (a partial St. Peter equivalent) in southern Oklahoma. The Connell Sandstone Member of the Oil Creek Formation, a generally subsurface unit in west Texas, crops out in the Beach and Baylor Mountains. Towns appear as red dots. |
Frac sand that is referred to as “Brown” or “Brady” sand is mined from local quartz arenites that are in the marine subarkosic to arkosic Upper Cambrian Hickory Sandstone Member (Kyle and McBride, 2014). In the Voca area, sand production is generally from a 50 to 65 ft. (15 to 20 m) near-surface lower interval of the Hickory Sandstone Member (Kyle and McBride, 2014). The suitability of this sand as a proppant is due to a combination of its depositional, burial, and diagenetic histories. The marine transgressive sands of the Hickory Member were derived from the Precambrian basement rocks and deposited on an extensive unconformity (Kyle and McBride, 2014). Some of the Hickory sands were reworked from older fluvial deposits and aeolian dunes and were redeposited as quartz arenites that have well-sorted and well-rounded grains (Kyle and McBride, 2012). Although they originally had a high feldspar content, some of the arkosic sandstones underwent diagenetic alteration that removed the feldspars, resulting in an elevated quartz content (Kyle and McBride, 2014). Furthermore, the sandstones remained friable near the Llano uplift, where they were never buried deeper than 1,500 ft. (about 1 km) (Kyle and McBride, 2014). Compared to the more suitable “Ottawa” or “Northern White” sands, these “Brown” or “Brady” sands have a higher percentage of coarser grades (8/16, 12/20, and 16/30) (Texas Frac Sands, 2014). Also, they are less crush resistant than the “Ottawa” sands because, rather than consisting of monocrystalline quartz, they are polycrystalline quartz grains (Levson and others, 2012).
Oil Creek Formation
The Middle Ordovician Oil Creek Formation is one of five formations within the Simpson Group (Wright, 1965; Suhm and Ethington, 1975) (Figure 5) that were deposited in the Permian Basin of west Texas and southeast New Mexico, and in Oklahoma’s Anadarko Basin (Jones, 2009) (Figure 10) (Plate 1). The southernmost depocenter for the Simpson Group was a broad, shallow, gently dipping depression referred to as the Tobosa Basin, a tectonic basin that was the precursor to the Permian Basin (Galley, 1958; Adams, 1965; Wright, 1965; Jones, 2009). At the time of Simpson Group deposition, the Tobosa Basin was separated from the Anadarko Basin by a peninsula that was an extension of the Transcontinental arch, also referred to as the Texas arch (Wright, 1965; Jones, 2009). The Simpson Group has been generally correlated with the St. Peter Sandstone of the Mississippi Valley (Dake, 1921; Suhm and Ethington, 1975).
The Simpson Group contains three sand units (the Connell, Waddell, and McKee) (Figure 5) that are oil-producing reservoirs in both the Permian and Anadarko Basins, with the greater production occurring in southern Oklahoma (Jones, 2009). These clean quartz sands are the basal members of the Oil Creek, McLish, and Tulip Creek Formations, respectively (Figure 5) (Suhm and Ethington, 1975; Jones, 2009). These three basal sands are described as containing 95 percent or more quartz, are well sorted and rounded, and have frosted grains (Howe, 1959; Suhm and Ethington, 1975). They tend to range in thickness from 20 to 50 ft. (6 to 15 m) (Jones, 2009).
In west Texas, surface exposures of the Connell Sandstone Member of the Oil Creek Formation occur in the Beach Mountains and the Baylor Mountains in Culberson County (Figure 10) (Plate 1), with thicknesses that range from 10 to 30 ft. (3 to 9 m), respectively (Suhm and Ethington, 1975). Although the Connell Sandstone Member has properties similar to equivalent-age midcontinent sandstones of the St. Peter Sandstone (Howe, 1959; Suhm and Ethington, 1975), the Connell in Texas does not appear to be currently mined as frac sand. The Connell Sandstone Member is present mostly in the subsurface of the Tobosa Basin, where it was named for a sand that produced oil in Ector County (Schweers, 1949; Wright, 1965; Suhm and Ethington, 1975).
In south-central Oklahoma, the Oil Creek Formation (Figure 10) (Plate 1) has been recognized in outcrops along the flanks of the Arbuckle Mountains in Murray and Johnston Counties (Buttram, 1913). The basal unnamed sand unit of the Oil Creek Formation is mined by U.S. Silica at Mill Creek in Johnston County, Oklahoma, for multipurpose sand used in glass, foundry molds, well stimulation (fracking), and building products sand (U.S. Silica, 2014b).
SILICA SANDS MINED FOR RESIN-COATED PROPPANTS
Sandstones of the Bidahochi Formation in Arizona and the unconsolidated Quaternary Loup River sands in Nebraska are less optimal for use as frac sand, but are suitable for use in the production of resin-coated sand proppants.
Bidahochi Sandstone
The uppermost informal member of the terrestrial Pliocene Bidahochi Formation is a tuffaceous, fluvio-lacustrine sandstone that extends from northeastern Arizona (Figure 11) (Plate 1) into nearby parts of New Mexico in the area northeast of the Little Colorado River (Repenning and Irwin, 1954). The sediments of the Bidahochi Formation were deposited by southwestward flowing streams (Hack, 1942) and were derived from the Chuska Mountains, and the Defiance, Zuni, and Mogollon Plateaus (Kiersch and Keller, 1955). The sandstone member is composed predominantly of white to very pale brown, cross-bedded, poorly cemented, medium- to fine-grained, argillaceous sandstone with a few beds of white rhyolitic ash (Repenning and Irwin, 1954), and has a maximum thickness of approximately 600 ft. (183 m) near Greasewood, Arizona (Kiersch and Keller, 1955). The sandstone member is an immature sandstone that was used as frac sand only sparingly and in shallow wells (Zdunczyk, 2007). In 2012, it was announced that Preferred Sands purchased a sand-mining operation with as many as three quarries in the Sanders area and is producing resin-coated proppants (Arizona Geology, 2012).
 |
| Figure 11. Surface exposures of sand source units in the Southwest that are used or are being considered for use as low-quality frac sand or for use in the manufacture of alternative proppants. In northeastern Arizona, the fluvio-lacustrine Pliocene Bidahochi Formation (orange) is mined as a substrate sand for the production of resin-coated proppants. In south-central Utah, the Quaternary aeolian dune sands (deep red) are at the surface in canyon country northwest of the Colorado River at Lake Powell. The Middle Jurassic White Throne Member (open circtes) of the Temple Cap Formation, which has limited suitability for frac sand, is exposed only in cliff faces in canyons in southwestern Utah. The Lower Permian White Rim and Cedar Mesa Sandstone Members (purple) of the Cutler Formation, which also have limited suitability for frac sand, are exposed in the popular recreation area of the San Rafael Swell. Towns appear as red dots. |
Loup River Sand
Quaternary fluvial deposits along the Loup River in Nebraska (Figure 12) are aeolian reworked sands derived from Pleistocene glacial outwash (Epley, 2014). These are being mined and processed by Preferred Sands of Genoa and used in the production of resin-coated sand proppant (Shale Reporter, 2013).
 |
| Figure 12. Surface exposures of sand source units in the Great Plains states that are used in the manufacture of alternative proppants or are being considered for future use as frac sand. In Genoa, in eastern Nebraska, modern fluvial sand deposits along the Loup River are being mined for use as resin-coated sand. The Upper Cambrian and Lower Ordovician Deadwood Formation (dark blue) along the flanks of the Black Hills of South Dakota has the attention of the mining community, as it is reported to be a potential frac sand. Towns appear as red dots. |
SILICA SANDSTONES WITH LIMITED POTENTIAL SUITABILITY FOR FRAC SAND
Additional known silica sand sources have been examined by several investigators for their potential use in the proppant industry. Despite the fact that these include pure silica sands that have been mined for use in glass manufacturing, they do not meet all the additional specifications for optimal frac sand under the API guidelines (Zdunczyk, 2007; Maslowski, 2012; Marshall and others, 2014). These units were mentioned in the literature as having been evaluated for frac sand potential. The discussion of these units is from oldest to youngest within geographic regions beginning with the Appalachian region (Figure 13) (Plate 1).
 |
| Figure 13. Surface exposures of quartzose sand source units in the Appalachian region that have limited potential suitability for use as frac sand. The units are identified as mapped from east to west as Antietam (dark brown), Chickies (yellow), and Oriskany (bright red) Formations; Clinch Sandstone (dark blue); Pottsville Group (lavender); undivided Buena Vista and Black Hand Sandstone Members (pale blue) of the Cuyahoga Formation; Black Hand Sandstone Member (turquoise) of the Cuyahoga Formation; and Berea (light green) and Sylvania (deep green) Sandstones. Towns appear as red dots. |
Appalachian Region
Antietam Formation
The Lower Cambrian Antietam Formation (also Erwin Formation according to Sweet [1986]) is the uppermost formation within the Chilhowee Group in Pennsylvania (Hack, 1982; Ryder and others, 1992) (Figure 13) (Plate 1). Sandstone from the Antietam Formation has roundness and sphericity of nearly 6.0; however, because it could not meet the test for crush resistance, it is not considered a good potential source for frac sand (Zdunczyk, 2007).
Chickies Formation
The Lower Cambrian Chickies Formation (also “Chiques” Quartzite) is exposed at Chickies Rock on the Susquehanna River in Lancaster County, Pennsylvania (Walcott, 1896) (Figure 13) (Plate 1). Although metamorphosed, the Chickies Formation is an example of the widespread marine Cambrian-Ordovician quartz arenites derived from the North American Craton or Canadian Shield (Pettijohn, 1972) that were deposited as basal sands on the eroded Proterozoic surface (Walcott, 1896). The quartzite of the Chickies Formation is mined for silica sand (Zdunczyk, 2007).
Clinch Sandstone
The Clinch Sandstone is a mature quartz arenite or orthoquartzite of Early Silurian age (also referred to as “Clinch Mountain Sandstone”) that is recognized in northeastern Tennessee (Driese, 1988), eastern Kentucky (Englund and others, 1963), and southwestern Virginia (Miller and Fuller, 1947) (Figure 13) (Plate 1). According to Herron (2006), the Clinch Sandstone is stratigraphically equivalent to the Tuscarora Formation of the northern Appalachian Basin. Within the Clinch Mountain system of northeastern Tennessee, the Clinch Sandstone is being mined for silica sand by Short Mountain Silica at Short Mountainnear Mooresburg in Hawkins County (Zdunczyk, 1992; Short Mountain Silica, 2014). Although the Clinch Sandstone generally does not meet the criteria for frac sand (Zdunczyk, 2007), the Short Mountain Silica Company states that a frac sand facility was installed at the Short Mountain location in 2012, where it produces 30/50 and 40/70 mesh sand used in the oil and gas industry (Short Mountain Silica, 2014). It is unclear whether the Short Mountain mine is the source for the frac sand or the sand is being brought into this facility from elsewhere for processing.
Oriskany Sandstone/Group
The U.S. Geological Survey recognizes the use of the name Oriskany as both a group and a formation of middle Early Devonian age. The Oriskany Group includes the Esopus Formation at the top and the Port Ewen Formation at the base, and where the undifferentiated deposits of Oriskany age are chiefly or wholly sandstone, the term Oriskany Sandstone is applied (Wilmarth, 1938). In central Pennsylvania, western Maryland, northern West Virginia, and parts of Virginia, the Oriskany Group is divided into the Ridgeley Sandstone (upper) and Shriver Chert (lower) (Wilmarth, 1938) (Figure 13) (Plate 1). Oriskany Group is mapped in Sussex County, northwestern New Jersey, where it is subdivided in ascending order into the Glenerie Formation, Shriver Chert, and Ridgeley Sandstone (Monteverde, 1992).
The Ridgeley Sandstone in west-northwestern Virginia is as much as 300 ft. (90 m) thick and is high in silica, predominantly white to light tan to light gray, and in places has a calcareous matrix that has been leached along fractures causing the rock to become friable sandstone or loose sand, making it especially attractive as a potential source of frac sand (Sweet, 1986). Unimin Corporation near Gore, Frederick County, Virginia, quarries the Ridgeley (Oriskany) Sandstone for glass sand (Sweet, 1986).
Elsewhere in Virginia, the high silica sandstone formation, referred to as the Oriskany Sandstone, has been described by Scholle (1979) as having quartz grains that are well rounded and show no euhedral overgrowths; however, they have irregular line contacts with adjacent minerals, and many quartz grains have strain shadows and Boehm lamellae suggesting significant deformation that would compromise their capacity to withstand high crush pressures (Scholle, 1979).
For the past century, U.S. Silica has been mining the 99.9 percent pure silica sand from Devonian Oriskany outcrops along the Warm Springs Ridge in northeastern West Virginia for use in non-proppant industries (U.S. Silica, 2014a).
Sylvania Sandstone
The Middle Devonian Sylvania Sandstone is the lowermost formation within the Detroit River Group. It is exposed in northwestern Ohio (Figure 13) (Plate 1) where it unconformably overlies rocks of the Silurian Salina Group (Ohio Division of Geological Survey, 1990 [rev. 2000, 2004]; Wolfe, 2013). The Sylvania Sandstone ranges in thickness from 0 to 95 ft. (0 to 29 m) and is described as a white, friable sandstone with well-rounded quartz grains; may contain scattered masses of calcite, celestite, and dolomite; and is interbedded with arenaceous dolomite with bands of chert (Wolfe, 2013). The sandstone is exposed in a quarry in Lucas County, Ohio, where it was historically used in the Toledo glass industry; and on the south bank of the Maumee River in Wood County (Heinrich, 2001). Wolfe (2013) names the Sylvania Sandstone among potential future sources for frac sand in Ohio.
The Sylvania Sandstone extends into Michigan, where it has characteristics typical of aeolian reworked near-shore marine sands that were likely sourced during Devonian time from outcrops of the Ordovician St. Peter Sandstone (Grabau and Sherzer, 1910; Heinrich, 2001). The Sylvania Sandstone is mapped in the subsurface of the Michigan Basin where its thickness increases northwestward reaching a maximum of nearly 400 ft. (120 m) (Heinrich, 2001). The unit has been mined for glass sand in Rockwood, Wayne County, southeastern Michigan, by the Ottawa Silica Company (Heinrich, 2001). U.S. Silica mines this unit at Rockwood for use in non-proppant industries (U.S. Silica, 2014c).
Berea Sandstone
In Ohio, the Upper Devonian Berea Sandstone (Figure 13) (Plate 1) is overlain by the Lower Mississippian Sunbury Shale (Ohio Division of Geological Survey, 1990 [rev. 2000, 2004]). The Berea Sandstone is light brown, medium to coarse grained with sub-rounded quartz grains, with a silica content of generally greater than 91 percent, aluminum oxide about 4 percent, and iron oxide less than 1 percent (Wolfe, 2013).
Buena Vista Sandstone Member
The Lower Mississippian Buena Vista Sandstone Member of the Cuyahoga Formation (Ohio Division of Geological Survey, 1990 [rev. 2000, 2004]) (Figure 13) (Plate 1) is a thin-bedded, fine- to medium-grained, sub-rounded quartz sandstone that is exposed in south-central Ohio and has been historically mined as a building stone (Wolfe, 2013).
Black Hand Sandstone Member
The Lower Mississippian Black Hand Sandstone Member of the Cuyahoga Formation (Ohio Division of Geological Survey, 1990 [rev. 2000, 2004]) (Figure 13) (Plate 1) contains silty and conglomeratic facies; however, it also occurs as a massive, coarse grained, 98 percent silica sandstone up to 100 ft. (30 m) thick that is mined as frac sand, as well as industrial sand in Knox County, Ohio (Wolfe, 2013).
Sharon Sandstone
The Pennsylvanian Sharon sandstone is the basal informal unit of the Pottsville Group in Ohio, where it unconformably overlies Mississippian strata (Ohio Division of Geological Survey, 1990 [rev. 2000, 2004]; Wolfe, 2013) (Figure 13) (Plate 1). Elsewhere, in Pennsylvania, Maryland, and other parts of Ohio, the unit is recognized as the Sharon Conglomerate Member of the Pottsville Formation (Rice and others, 1994). The Sharon Conglomerate Member crops out in Pennsylvania and northeastern Ohio (Fuller, 1955). In Ohio, the unit referred to here as the informal Sharon sandstone is mined for glass, industrial, and frac sand use where it is described as a massive, fine- to coarse-grained, high-silica sandstone and pebble conglomerate with a thickness range from 10 to 60 ft. (3 to 18 m) as exposed in quarries (Wolfe, 2013). Parameters that support its consideration for use as a frac sand include these: silica content that can exceed 99 percent, roundness/sphericity of 0.6–0.7, solubility of 2.9 percent, turbidity of 19, crush resistance of up to 6,000 psi, and an acceptable size distribution (Wolfe, 2013). The unusually high silica content of this unit is attributed by Fuller (1955) to the multi-cycling and transport of sediments long removed from the older igneous, metamorphic, and sedimentary source rock by streams of considerable competency and eventually deposited as a delta in a shallow basin overlying the Mississippian unconformity.
The Sharon sandstone is mapped with many other units within the Pottsville Group and is therefore overrepresented on Figure 13 and Plate 1.
Massillon Sandstone
The Pennsylvanian Massillon sandstone is an informal unit within the Pottsville Group in Ohio (Ohio Division of Geological Survey, 1990 [rev. 2000, 2004]; Wolfe, 2013) (Figure 13) (Plate 1). The unit is described as a light brown to white, fine- to medium-grained, high-silica sandstone with a maximum thickness of 100 ft. (30 ft) in east-central and northeastern Ohio. Although currently mined for industrial sand and building stone, it may be considered for future use in fracking because of its roundness/sphericity of 0.5–0.6, acid solubility of 1.9 percent, and turbidity of 78 (Wolfe, 2013). Massillon is mapped with many other units within the Pottsville Group and is, therefore, overrepresented on Plate 1.
Great Plains Region
Deadwood Formation
The Upper Cambrian and Lower Ordovician Deadwood Formation in South Dakota (Figure 12) (Plate 1) has been described as a variegated, yellow to red, brown, gray, and green, glauconitic, conglomerate, sandstone, shale, dolomitic limestone, and dolomite; with a thickness of 4–400 ft. (1–122 m) (Martin and others, 2004). Although studies by Ching (1973) and Huq (1983) indicated that parts of the Deadwood Formation are potential sources for frac sand, the South Dakota Geological Survey reports that the formation is not a prospective frac sand source (Marshall and others, 2014). When compared with API requirements for frac sand, the Deadwood Formation does not consist of >99 percent quartz, has too broad a grain size distribution, has grains that are not the correct shape, and is too tightly cemented (Rapid City Journal, 2014). Despite these differences in assessments of the Deadwood Formation’s frac sand potential, South Dakota Proppants LLC, is currently pursuing permits to develop a mine, processing plant, and transportation hub in an area of the Black Hills National Forest (Hirji, 2014).
Southwest Region
White Rim and Cedar Mesa Sandstone Members
The Lower Permian White Rim Sandstone and Cedar Mesa Sandstone Members of the Cutler Formation are recognized in the subsurface of the Paradox Basin of Utah (Baker and Reeside, 1929; Steele, 1987). The White Rim Sandstone Member is a quartz sandstone of shallow margin origin that forms the top of the Cutler Formation and is overlain by the Triassic Moenkopi Formation (Blakey, 1974). It was deposited in a coastal environment during marine transgression where it was later exposed to aeolian and other nonmarine processes (Steele, 1987). Where the White Rim and Cedar Mesa Sandstone Members are exposed along the flanks of the San Rafael Swell in Emery County, Utah (Figure 11) (Plate 1), they are proposed by Rupke (2014) as potential frac sand sources.
White Throne Member
The Middle Jurassic White Throne Member of the Temple Cap Formation in Kane and Washington Counties, Utah, (Figure 11) (Plate 1) is proposed by Rupke (2014) as a potential frac sand source. The Temple Cap Formation has limited geographic extent and occurs as the basal sandstone unit of the San Rafael Group that unconformably overlies the Navajo Sandstone in extreme western Kane County and extreme eastern Washington County (Peterson and Pipiringos, 1979). At the type section in Zion Canyon, Washington County, the Temple Cap Formation is subdivided (in descending order) into the White Throne Member: a 49.7-m (163-ft) thick, fine-grained, well-sorted, cross-bedded sandstone; and the Sinawava Member: a 6.1-m (20-ft) thick, flat-bedded sandstone, silty sandstone, and mudstone (Peterson and Pipiringos, 1979). The White Throne Member is a cliff-forming unit that is exposed in canyon walls in Johnson Canyon, Mount Carmel Junction, and Zion Canyon, and pinches out westward into a thick deposit of the otherwise underlying Sinawava Member (Peterson and Pipiringos, 1979).
Quaternary Aeolian Dune Sands
Quaternary aeolian dune sands in Kane and Washington Counties, Utah (Figure 11) (Plate 1), are proposed by Rupke (2014) as potential future frac sand sources.
GEOLOGIC ORIGIN AND PRESERVATION OF FRAC SAND DEPOSITS
Geological Processes Contributing to Frac Sand Formation
The best frac sands are supermature quartz arenites that owe their physical and chemical characteristics to their origin as marine shoreline sands that were multiply reworked by wind and water (Winfree, 1983), were never deeply buried, or they later underwent diagenesis or intense chemical weathering that reduced or removed cements (Dott and others, 1986; Dott, 2003). Many pure quartz arenites were deposited in non-orogenic basins during early Paleozoic and Proterozoic time (Dott, 2003).
The multiple cycles of mechanical reworking contributes to the proper shaping of grains, mineralogical maturity, and grain-size sorting (Levson and others, 2012). There are many depositional settings in which sand is reworked, but the geologically older the sand deposit, the more chance it has had to undergo multiple cycles of sediment reworking (Levson and others, 2012). Environments that allow for aeolian abrasion produce exceptional rounding of grains (Dott, 2003). It has been observed that sand in aeolian settings experiences abrasion from wind that can be 100 to 1,000 times more effective at rounding grains than transport by water (Kuenen, 1959, 1960). Additional characteristics of these sands that are consistent with recycling are mixed sources, upward maturation, association with major unconformities, and an inverse relationship between labile (unstable) grain content and grain size (Dott, 2003).
The history and provenance of the source quartz sand affects the strength or hardness of the grains. Quartz grains that have undergone metamorphism or tectonic shear stress may contain weak planes that may fail under the high pressure conditions to which the sand is exposed during hydrofracking (Zdunczyk, 2007; Levson and others, 2012). Also, single-crystal (monocrystalline) sands have greater compressive strength than do grains consisting of multiple intergrown crystals (polycrystalline) (Roberts, 2009).
Post-depositional diagenesis can add textural maturation to multi-cycled sands or can independently form pure quartz arenites (Dott, 2003). Long periods of land stabilization are necessary for intense weathering (Dott, 2003).
Although the highest quality frac sand owes its origin to multi-cyclical deposition or post-depositional diagenetic processes, mineralogic and texturally mature quartz-rich sands can also form in humid climates through intense single-cycle weathering of underlying crystalline basement rock (Dott, 2003).
Depositional Environments Favoring Accumulation of Frac Sand
Among the most prospective settings for the accumulation of quartz arenites that produce frac sand are marine shoreline and coastal aeolian environments (Mazzullo and Ehrlich, 1983; Winfree, 1983; Dott and others, 1986; Dott, 2003). In addition to marine shoreface environments, marine intertidal and deltaic settings are considered prospective environments for the generation of frac sand in Canada (Hickin and others, 2010). The perfect example of the ideal combination of frac sand-producing environments is the high-quality frac sand of the Ordovician St. Peter Sandstone of the midwestern United States that formed as coastal aeolian deposits (Mazzullo and Ehrlich, 1983) and marine offshore and shoreface deposits that were reworked by aeolian processes (Winfree, 1983).
Settings that produce less ideal sands that may be processed for use as proppant include younger aeolian, glaciodeltaic, and glaciofluvial environments (Hickin and others, 2010). Examples of unconsolidated frac sand from glaciofluvial deltaic and aeolian settings are known from northeastern British Columbia, Canada (Hickin and others, 2010). Also identified as potential unconsolidated sources are Quaternary sand dune deposits derived from older glaciofluvial or sandy glaciolacustrine sediments and (or) sandy bedrock units that have been reworked along major rivers; and paleobeach ridges and dunes (Levson and others, 2012). In the United States, near Genoa, Nebraska, sand is mined for use as seed sand for resin coating from the highly mature, fluvially deposited, aeolian-reworked, glacial outwash-derived, unconsolidated Holocene Loup River deposits (Epley, 2014).
Post-depositional Processes Affecting Near-surface Access to Frac Sand
Certain post-depositional processes have enhanced surface access to the targeted frac sand deposits. Fluvial erosion by major river systems has exposed Paleozoic frac sand units to the surface. Examples of this are seen along the course of the Mississippi River from Minnesota to Arkansas. As well, tectonic uplift has enhanced the fluvial exposure of Paleozoic frac sand units in areas bordering the Mississippi River Valley, such as to the east of the Ozark Plateau along the White River in northern Arkansas, where the St. Peter crops out. Complete removal of the units at erosional unconformities has left, at the margins, exposures of truncated layers. Tectonism in the Llano uplift of Texas has prevented deep burial and cementation of the Hickory Sandstone Member and has resulted in the faulted patchwork outcrop pattern that guides the location of “Brown” frac sand mines.
Much of the frac sand mining in the Midwest is from near-surface Paleozoic sandstones of west-central and southwestern Wisconsin; and portions of southeastern Minnesota, northeastern Iowa, and northwestern Illinois referred to as the “driftless area” (Syverson and Colgan, 2004) (Figure 7) (Plate 1). The “driftless area” has long been defined as an area untouched by the advance of the last of the Wisconsinan (35,000 to 10,000 years B.P. [age in time “before present”]) ice sheets (which includes those of the “last glacial maximum” that occurred 25,000 to 21,000 years ago) or by earlier Wisconsinan (prior to 35,000 years B.P.) ice sheets (Syverson and Colgan, 2004; Syverson and others, 2011). As such, the area was neither stripped of the near-surface Paleozoic strata (as in northern Wisconsin) nor deeply buried beneath glacial till (as in eastern Wisconsin). Over the past approximately 2 million years, large volumes of glacial meltwater drained into the Mississippi River system as the Wisconsinan ice sheets receded, deeply eroding and exposing the nearly flat-lying Ordovician and Cambrian strata in the incised terrain (Runkel and Steenberg, 2012). This has resulted in the exposure of the frac sand source units in river bluffs and hillsides, and in the near surface.
A combination of downwarping and burial by glacial sediments has rendered the frac sand source units in the area of southeastern Minnesota westward of Olmsted County nearly inaccessible and, therefore, not economically recoverable at current prices. In this area, subtle downwarping of the Paleozoic beds in the Hollandale embayment, which extends southward into parts of northeastern Iowa, buried and preserved the frac sand source units (Runkel and Steenberg, 2012). These Paleozoic units were later covered with a veneer of unconsolidated glacially derived sediments from tens to hundreds of feet thick, making access to the frac sand units unfeasible in that area, except within major river valleys such as the Minnesota River in Minnesota, where the Paleozoic units that rise toward the eastern flank of the Transcontinental arch have been exposed by fluvial erosion (Runkel and Steenberg, 2012).
Post-glacial depositional processes have influenced the distribution and thickness of overburden on the frac sand source units of the Midwest. Although the glacial outwash drainage system in the driftless area cut deeply into the Ordovician and Cambrian beds of western Wisconsin and extreme eastern Minnesota, removing major thicknesses of overburden from most of the frac sand mining area, relict glacial outwash deposits obscure portions of the river valleys (Runkel and Steenberg, 2012). Quaternary loess deposits also form several meters of cover on upland divides in the driftless area of western Wisconsin (Syverson and others, 2011). Mineability of the frac sand units may not be locally feasible because of the thickness and nature of the overburden (Runkel and Steenberg, 2012).
Post-depositional Processes Affecting the Quality of a Potential Frac Sand Source
Post-depositional processes during burial and diagenesis can alter the sphericity and roundness of grains and the friability of the sandstone unit. Such alterations are not uncommon in many of the frac sand source units.
Despite the overall desirability of St. Peter Sandstone as a frac sand source, there are local areas in which portions of the unit naturally exhibit characteristics that are less optimal for use as frac sand. In these areas, portions of the deposit have undergone diagenetic alteration that has resulted in secondary grain overgrowths, dissolution, and cementation of the sand (Winfree, 1983; Kelly, 2006; and Kelly and others, 2007). For example, shallowly buried (<1 km) quartz arenites of the St. Peter Sandstone in an area of southwestern Wisconsin and southeastern Minnesota show authigenic overgrowths on detrital quartz grains that are interpreted to have originated during the formation of silcretes by precipitation from meteoric water during paleofluid flow events early in the St. Peter Sandstone’s history (Kelly, 2006; Kelly and others, 2007). Quartz grain overgrowths were also observed in the St. Peter Sandstone in south-central Wisconsin (Clayton and Attig, 1990). These grain overgrowths reduce roundness and sphericity, and introduce weaker planes along authigenic crystal boundaries. The precipitation of silica cement occludes porosity and reduces friability. In other post-depositional settings, sandstones that were originally cemented with carbonate minerals can develop increased friability as a consequence of dissolution during early diagenesis or later-stage post-depositional exposure to groundwater flow or surface weathering.
CHALLENGES TO THE FRAC SAND INDUSTRY
Competition among Frac Sand Operators for New Domestic Sources
The challenges to finding new frac sand reserves include identifying additional sand sources that have the following criteria (Rock Products, 2014d):
- meet API specifications,
- have sufficient contiguous volume to be economic, and
- are in close proximity to oil and natural gas reservoirs or have rail access needed for cost-efficient transportation to major shale basins (Figure 1).
Successful exploration for additional frac sand reserves will likely be somewhat guided by the following set of geological characteristics of known deposits (Zdunczyk, 2007):
- lower Paleozoic supermature quartz arenites deposited on a broad, low-relief (shallow) marine shelf (Sloss, 1988), bordering a slowly subsiding, relatively stable, continental interior basin (Sloss, 1988; Runkel and others, 2007);
- quartz arenites that have undergone extensive chemical weathering in a warm, wet climate, and have experienced a long history of transport and reworking (Sloss, 1988);
- transgressive sheet sands laid down on a regionally extensive unconformable surface (Barnes and others, 1996);
- shallow marine paralic (at or near sea level) and shelf sands laid down on an unconformable surface of a regressive marine shale (Barnes and others, 1996); and
- post-depositional burial in areas free of intense tectonic or metamorphic activity to ensure preservation of original textures such as monocrystallinity of grains (absence of diagenetic overgrowths), crush resistance of quartz grains (absence of tectonically induced weak planes), and minimal intergranular cementation (Zdunczyk, 2007).
Canada’s Pursuit of Frac Sand Sources
Canada is a major consumer of premium frac sand from the Midwest of the United States, although they have sources that are currently mined in Alberta and Saskatchewan, with others in Manitoba scheduled to come online in 2015 (Figure 14). To improve their independence from the U.S. market, Canadian companies and provincial agencies have undertaken an extensive effort to identify and develop their own frac sand sources. Production and reserve values are shown in units as published in the cited references. No standard use of either metric or English units is implied in cases where the unit is reported only as “ton” by the original source.
 |
| Figure 14. Index map of place names, provinces, and physiographic features mentioned in the description of mined and potential sources for frac sand in Canada. |
Alberta
Peace River: The Peace River (Figure 14) Frac Sand Quarry, which is owned and operated by Canadian Silica Industries, produces frac sand from the Lower Cretaceous Paddy Member of the Peace River Formation. The Peace River Frac Sand Quarry reportedly has a total annual capacity of 500,000 tonnes of silica sand. This operation is located in close proximity to the Horn River and northwestern Deep Basins (Figure 1), and is central to the frac sand market within northwestern Alberta (The Wall Street Journal, 2014).
Fort McMurray: A frac sand deposit known as the Firebag deposit is north of Fort McMurray (Rock Products, 2014a) (Figure 14). Athabasca Minerals has a prospective frac sandstone deposit in this area with an estimated capacity of 1,000,000 tons per year (tpy) (Claim Post Resources Inc., 2013). Preliminary testing indicates that the Firebag sand meets or exceeds API/ISO specs for frac sand. A location that is 1,200 mi (about 2,000 kilometers) closer to key Canadian markets makes this project advantageous.
British Columbia
The Rocky Mountain foothills between Mackenzie and Fort St. John (Figure 14): The Middle to Upper Triassic Liard Formation, the Upper Triassic Charlie Lake Formation; and the Upper Jurassic to Lower Cretaceous Monteith Formation and Lower Cretaceous Monach Formation of the Minnes Group are the most prospective bedrock units assessed for potential frac sands in the province (Hickin and others, 2010). The Liard Formation is mainly a calcite-cemented, fine- to medium-grained, well- to sub-rounded to sub-angular, 90 percent quartz arenite of marine shoreface origin (Hickin and others, 2010). The Charlie Lake Formation is a calcite-cemented, fine- to medium-grained, well- to sub-rounded, feldspathic arenite of marine intertidal origin (Hickin and others, 2010). The Monteith Formation is a silica-cemented, fine- to medium- to coarse-grained, sub-angular to sub-rounded, 95 percent quartz arenite of deltaic origin (Hickin and others, 2010). The Monach Formation is a medium- to coarse-grained sand and coarse to granule conglomerate, rounded to sub-rounded, 95 percent quartz arenite of deltaic origin (Hickin and others, 2010).
Horn River Basin: unconsolidated deposits with good potential as frac sands include the Komie glaciofluvial delta deposits on the western edge of the Horn River Basin (Hickin and others, 2010) (Figure 1).
Dawson Creek: unconsolidated deposits with good potential as frac sands include the Redwillow glaciofluvial delta south of Dawson Creek (Hickin and others, 2010) (Figure 14).
Fort Nelson: unconsolidated deposits with good potential as frac sands include the aeolian deposits of the Fontas Dune Field southeast of Fort Nelson (Hickin and others, 2010) (Figure 14).
Golden: The Moberly frac sand project is due to expand its glass sand mine for potential frac sand with an estimated capacity of 300,000 tpy (Claim Post Resources Inc., 2013).
Prince George, Nelson: Stikine Energy Corporation has two active frac sand exploration projects, the Nonda and Angus projects, each having an estimated capacity of 1,000,000 tpy (Claim Post Resources Inc., 2013). These are north of Prince George near the Yukon border (Levson and others, 2012) (Figure 14). These frac sand projects will require processing that includes crushing, liberation, and cleaning/sorting (Stikine Gold, 2014). The Nonda project is 150 km (93 mi) west of the Horn River Shale Basin (Figure 1), consists of a quartz-pure sandstone in 40/70 and 100 mesh sizes that is very homogeneous and has a surface exposure >11.5 km x 1 km (>7.1 mi x 0.6 mi) (Stikine Gold, 2014). The Angus project is 200 km (124 mi) south of the Montney Shale Basin (Figure 1), consists of quartz-pure sandstone in 20/40, 30/50, and 40/70 mesh sizes that has a surface exposure of >5 km x 1 km (>3.1 mi x 0.6 mi) (Stikine Gold, 2014).
West of Flin Flon: Hanson Lake Sands has a frac sand deposit with an estimated capacity of 800,000 tpy (Claim Post Resources Inc., 2013). (Figure 14).
Northwest Territories
Fort Liard: Silica North Resources, Ltd., has an active frac sand exploration project (Levson and others, 2012). (Figure 14).
Mackenzie River: less than optimally accessible quartz-rich sandstone of the Proterozoic Katherine Group and the Cambrian Mount Clark Formation occurs along the Mackenzie River (Figure 14); and potentially accessible units are at Great Slave Lake (Proterozoic Preble, Kluziai, and Hornby Channel Formations and the Cambrian Old Fort Island Formation) (Levson and others, 2012). Also, Quaternary sand units with high frac sand potential include sand dune deposits derived from older glaciofluvial or sandy glaciolacustrine sediments, and/or sandy bedrock units (examples of these include the reworked sand units located along the Mackenzie River in the Fort Good Hope, Mountain River, Tulita, Keele River, and Fort Simpson areas, Northwest Territories) (Levson and others, 2012). As well, the sandy glaciofluvial deposits along the Liard Highway and paleo-beach ridges and dunes along the North Arm of Great Slave Lake are considered units with high economic potential as frac sand (Levson and others, 2012).
Manitoba
Seymourville: Claim Post Resources, Inc., is developing a surface frac sand deposit in the Seymourville area (Figure 14) that is targeted for production in 2015, with estimated capacity of 400,000–1,200,000 tpy. The company has combined the Gossan and Char Crete leases into a single 2.5 mi2 project on east shore of Lake Winnipeg, northeast of Winnipeg, Manitoba. These leases are across lake from Black Island, which has had historical production of white silica sand from a quarry on its southeastern shoreline (Claim Post Resources Inc., 2013).
Northern Manitoba: Vickory Nickel, Inc., has a prospective frac sand deposit with an estimated capacity of 500,000 tpy that is 60 m (about 200 ft.) below rock within a nickel mine (Claim Post Resources Inc., 2013). (Figure 14).
Saskatchewan
Winn Bay: Preferred Sands acquired Winn Bay Sand in 2011 (Snyder, 2013). This deposit occurs in sandstone of the Ordovician Winnipeg Formation (Levson and others, 2012).
Lloydminster: Canfrac Sands Ltd. transports about 50,000 to 100,000 tons of frac sand per year from this deposit (Snyder, 2013). (Figure 14).
Multiple Provinces
Canadian stratigraphic units with future frac sand potential exist in the Liard River Valley in British Columbia, Yukon, and Northwest Territories (Figure 14) in the Carboniferous Mattson Formation and Cretaceous Sikanni, Scatter, and Dunvegan Formations (Levson and others, 2012).
Substitutes for natural frac sand include resin-coated sand and manufactured proppants such as ceramic beads made from materials obtained from sintered bauxite (Beckwith, 2011; Dolley, 2012).
Development of Alternative Proppants
Resin-Coated Sand
Proppants manufactured as resin-coated sand are touted as being better-performing than “Northern White” sand as to permeability, conductivity, crush resistance, and reduced flowback in a variety of temperature and pressure conditions (Preferred Sands, 2012). The compressive strength (crush resistance) of the grains is increased by the resin coating, which shields the grains from fracture closure stresses, prevents shattering, and contains any fines produced (Pallanich, 2013; Fairmount Santrol, 2014). Another advantage of resin-coated proppants is that they can be made available in a range of mesh sizes (Preferred Sands, 2012). Resin-coated sands consist of less-optimal silica sand, as a substrate (seed), that has been coated with either phenolic or non-phenolic resin to reach the desired shape, grain size, and other properties. According to a manufacturer of proppants using non-phenolic resin, these proppants are environmentally “greener,” as they require less energy to produce, and are more cost-effective than the phenolic resin-coated proppants (Preferred Sands, 2012).
Resin coatings can be either pre-cured (bonded before going downhole) or curable (bonds grains together in response to high downhole pressures and temperatures) to minimize or prevent proppant flow-back (Beckwith, 2011; Pallanich, 2013). Curable resin treatments can be applied to both sand and ceramic proppant (Beckwith, 2011).
Synthetic Proppants
Ceramic proppants are manufactured from nonmetallurgical bauxite or kaolin clay that is sintered (powdered and baked in high-temperature kilns) to reduce water content and increase density, roundness, and strength (Beckwith, 2011). In this process, the sintered bauxite is mixed with additives such as aluminum oxide, silicate, and iron-titanium oxide (ShanXi GuangYu Ceramic Proppant Company, 2012). Despite their higher cost compared to natural frac sand, ceramic proppants are more homogenous in composition and more uniform in size and roundness, giving them a higher fracturing strength in wells at greater depths and higher pressures, and they have greater conductivity than either natural frac sand or resin-coated proppants (ShanXi GuangYu Ceramic Proppant Company, 2012).
The manufacture of synthetic proppants relies upon natural resources of aluminum-rich minerals that include bauxite, kaolinite, alunite, and halloysite (Rupke, 2014). Because the production of alumina on a commercial scale in the United States relies almost entirely on its recovery from bauxite (Bray, 2014), the synthetic proppant industry is dependent upon the domestic and global supply of bauxite.
Nearly all of the bauxite consumed in the United States is imported, and there is no government stockpile (Bray, 2014). The world bauxite resources are estimated at 55 to 75 billion tons, and are distributed on the following continents: Africa (32%), Oceania (23%), South America and the Caribbean (21%), Asia (18%), and elsewhere (6%) (Bray, 2014). The principal countries from which the United States imports both bauxite and alumina are Jamaica, Brazil, Guinea, and Australia (Bray, 2014). Additional countries that mine bauxite are China and India (Beckwith, 2011).
Potential non-bauxite sources for alumina in the United States might include clay, alunite, and anorthosite (Bray, 2014). Kaolin (an aluminum silicate clay mineral) deposits in central Georgia are the principal U.S. sources of kaolin, accounting for 92% of domestic production (Virta, 2014). CARBO, a ceramic proppant producer, has a facility in Toomsboro, Georgia (Plate 1), that is close to these kaolin sources (Beckwith, 2011). Globally, countries with substantial resources of kaolin include Brazil, Bulgaria, France, the United Kingdom, Iran, Germany, India, Australia, Korea, China, and the Czech Republic (Beckwith, 2011).
As the synthetic proppant industry grows with advancements in technology, the suitability of alternative raw materials such as coal waste and oil shale, is being explored (Bray, 2014). One example of success in this effort is credited to an engineered proppant developer at Penn State University, referred to as Nittany Extraction Technologies Company (NETCo), whereby it is using waste material that includes glass, alumina silicate mine tailings, fly ash, metallurgical slags, and rock cuttings from oil and gas drilling as raw materials in the manufacture of its ceramic proppant (Beckwith, 2011).
Future Outlook for the Demand for Frac Sand and Alternative Proppants
As unconventional oil and gas production is expected to play a major role in meeting the global demand for energy, a greater demand for frac sand and manufactured proppants is anticipated (Snyder, 2013). Projections of growth in the energy market have resulted in the following predictions of market demand for frac sand.
According to The Freedonia Group, a Cleveland-based market research firm, the North American frac sand market is estimated to increase as much as 8.9 percent each year through 2016 to 34.4 million metric tons (Mt), valued at $2.2 billion. They project that, by 2016, the U.S. will continue to lead the world in frac sand consumption using 75 percent of the market supply; while Canada will be second in volume consuming 8 percent of the market supply (Rock Products, 2014b).
The Freedonia Group predicts that continued demand for proppants into 2017 will result in an increase of more than 11 percent per year, reaching a sum of 57.1 billion lb. (28.5 million tons), with a market value of $6.1 billion (Steinbock, 2014).
On the global front, The Freedonia Group reports that Russia and China are developing frac sand markets with their expansion of hydraulic fracturing; however, they tend to rely more on ceramic proppants, curtailing their participation in the frac sand market (Rock Products, 2014b).
Acknowledgments
We wish to acknowledge the following U.S. Geological Survey (USGS) team members who contributed their ideas, effort, and expertise to this project: Rob Robinson, Rhonda Driscoll, Bill Heran, John Horton, Bruce Smith, Lisa Rukstales, Tom Dolley, Don Bleiwas, and Chris Potter. We appreciate the thoughtful review of this manuscript by Don Bleiwas, Bill Langer, and Tom Judkins, all of the USGS. We recognize Kate Golden of Wisconsin Watch Organization and Ted Auch of Frac Tracker.org for generously sharing their data and suggestions with us, advancing our progress on the frac sand digital geology map. We also appreciate the revised digital geology map provided by Robert McKay of the Iowa Geologic Survey. Any use of trade, product, or firm names is for descriptive purposes only and does not imply endorsement by the U.S. Government.

References
- Adams, J.E., 1965, Stratigraphic-tectonic development of Delaware Basin: American Association of Petroleum Geologists Bulletin, v. 49, p. 2140-2148.
- American Petroleum Institute, American National Standards Institute, and International Organization for Standardization, 2008, Measurement of properties of proppants used in hydraulic fracturing and gravel-packing operations, ISO 13503; Petroleum and natural industries–Completion fluids and materials, (first ed.): Washington, DC, API Publishing Services, 30 p.
- Arizona Geology, 2012, Arizona frac sand production increasing, http://arizonageology.blogspot.com/2012/12/arizona-frac-sand-production-increasing.html (accessed 04-08-14).
- Baker, A.A., and Reeside, J.B., Jr., 1929, Correlation of the Permian of southern Utah, northern Arizona, northwestern New Mexico, and southwestern Colorado: American Association of Petroleum Geologists Bulletin, v. 13, no. 11, p. 1413–1448.
- Barnes, D.A., Harrison, W.B., III, and Shaw, T.H., 1996, Lower-Middle Ordovician lithofacies and interregional correlation, Michigan Basin, U.S.A., in Witzke, B.J., Ludvigson, G.A., and Day, J., eds., Paleozoic sequence stratigraphy—Views from the North American Craton: Geological Society of America Special Paper 306, p. 35–54.
- Barnes, V.E., and Bell, W.C., 1977, The Moore Hollow Group of central Texas: University of Texas, Austin, Bureau of Economic Geology, Report of Investigations 88, 169 p.
- Beckwith, Robin, 2011, Proppants: Where in the World: Journal of Petroleum Technology, April 2011, p. 36–41.
- Blakey, R.C., 1974, Stratigraphic and depositional analysis of the Moenkopi Formation, southeastern Utah: Utah Geological and Mineral Survey Bulletin 104, 81 p.
- Bray, E.L., 2014, Bauxite and alumina: U.S. Geological Survey Mineral Commodity Summaries, p. 26–27.
- Brown, B.A., 2014, Hydrofrac sand in Wisconsin: Wisconsin Geological and Natural History Survey, http://monroe.uwex.edu/files/2012/02/Frac_sand_in_Wisconsin1.pdf, 01-30-14.
- Buchsbaum, Lee, 2013, The future of fracking—Management in action, http://www.miningmagazine.com/management-in-action/the-future-of-fracking, 07-10-14.
- Buttram, Frank, 1913, The glass sands of Oklahoma: Oklahoma Geological Survey Bulletin 10, 91 p.
- Catacosinos, P.A., 1973, Cambrian lithostratigraphy of the Michigan Basin: American Association of Petroleum Geologists Bulletin, v. 57, no. 12, p. 2404–2418.
- Ching, P.D., 1973, An investigation of the Cambrian Deadwood Sandstone in the central and southern Black Hills, South Dakota, as potential industrial silica sands: Rapid City, South Dakota School of Mines and Technology, Master’s degree thesis, 181 p.
- Claim Post Resources Inc., 2013, Seymourville frac sand project, Manitoba, Canada—Providing premium white frac sand to the Canadian oil service industry, (04-08-14).
- Clayton, Lee, and Attig, J.W., 1990, Geology of Sauk County, Wisconsin: Wisconsin Geological and Natural History Survey Information Circular 67, 68 p.
- Cole, V.B., 1975, Subsurface Ordovician-Cambrian rocks in Kansas: Kansas Geological Survey, Subsurface Geology Series 2.
- Cottingham, J.T., 1990, Cambrian-Early Ordovician sequence stratigraphy and Mt. Simon Sandstone petrology in the Michigan Basin: Kalamazoo, Western Michigan University, Master’s degree thesis, 87 p.
- Dake, C.L., 1921, The problem of the St. Peter Sandstone: School of Mines and Metallurgy, University of Missouri Bulletin, v. 6, no. 1, p. 225.
- Dapples, E.C., 1955, General lithofacies relationships of St. Peter Sandstone and Simpson Group: American Association of Petroleum Geologists Bulletin, no. 39, p. 444–467.
- Davis, J.G., 2011, Generalized isochore map of St. Peter Sandstone mineral resource in Missouri, Map: Rolla, Missouri, Missouri Department of Natural Resources, Division of Geology and Land Survey, Industrial Minerals Unit, scale 1:2,560,000.
- Dolley, T.P., 2012, Silica, 2010 Minerals Yearbook (Advance Release): U.S. Geological Survey, p. 66.61–66.16.
- Dott, R.H., Jr., 2003, The importance of eolian abrasion in supermature quartz sandstones and the paradox of weathering on vegetation-free landscapes: Journal of Geology, v. 111, p. 387–405.
- Dott, R.H., Jr., Byers, C.W., Fielder, G.W., Stenzel, S.R. and Winfree, K.E., 1986, Aeolian to Marine Transition in Cambro-Ordovician Cratonic Sheet Sandstones of the Northern Mississippi Valley, U.S.A., Sedimentology, v. 33, p. 345–367.
- Driese, S.G., 1988, Depositional history and facies architecture of a Silurian foreland basin, eastern Tennessee, in Driese, S.G., and Walker, D., eds., Depositional history of Paleozoic sequences, southern Appalachians, Society of Economic Paleontologists and Mineralogists, Midcontinent Section, 6th Annual Meeting: University of Tennessee, Department of Geological Sciences Studies in Geology, p. 62–96, 114–135.
- Englund, K.J., Smith, H.L., Harris, L.D., and Stephens, J.G., 1963, Geology of the Ewing quadrangle, Kentucky and Virginia, Contributions to economic geology, 1961: U.S. Geological Survey Bulletin 1142-B, p. B1–B23.
- Epley, Cole, 2014, Turns out the Loup Power District’s excess sand is perfect for fracking and worth millions: Omaha World-Herald, http://www.omaha.com/article/20140218/MONEY/140218799/1697 (accessed 02-18-14).
- Fairmount Santrol, 2014, Why choose resin-coated proppant over frac sand for moderate well conditions?, http://fairmountsantrol.com/wp-content/uploads/2014/09/Why-Choose-Resin-vs-Raw-Sand-PAS-914.pdf (accessed 10-12-14).
- Fuller, J.O., 1955, Source of Sharon Conglomerate of northeastern Ohio: Geological Society of America Bulletin, v. 66, no. 2, p. 159–176.
- Galley, J.E., 1958, Oil and geology of the Permian Basin of Texas and New Mexico, in Weeks, L.G., ed., Habitat of oil—A symposium: Tulsa, Oklahoma, American Association of Petroleum Geologists, p. 395-446.
- Geiver, Luke, 2014, Entering the frack sand industry, Bakken Magazine, April 22. http://www.thebakken.com/articles/602/entering-the-frack-sand-industry (accessed 08-13-14).
- Glick, E.E., and Frezon, S.E., 1953, Lithologic character of the St. Peter Sandstone and the Everton Formation in the Buffalo River Valley, Newton County, Arkansas: U.S. Geological Survey Circular 249, 39 p.
- Grabau, A.W., and Sherzer, W.H., 1910, The Monroe Formation of southern Michigan and adjoining regions: Michigan Geological Survey, Publication 2, Geological Series 1.
- Hack, J.T., 1942, Sedimentation and volcanism in the Hopi Buttes, Arizona: Geological Society of America Bulletin, v. 53, p. 335–372.
- Hack, J.T., 1982, Physiographic divisions and differential uplift in the Piedmont and Blue Ridge: U.S. Geological Survey Professional Paper 1265, 49 p.
- Heinrich, E.W., 2001, Economic geology of the sand and sandstone resources of Michigan: Michigan Geological Survey Division Report of Investigation 21, 31 p.
- Herron, S., 2006, Silica—Industrial sand and sandstone, Industrial minerals and rocks, (7th ed.): Littleton, Colorado, Society for Mining, Metallurgy, and Exploration, Inc., p. 815–832.
- Hickin, A.S., Ferri, Fil, Ferbey, Travis, and Smith, I.R., 2010, Preliminary assessment of potential hydraulic fracture sand sources and their depositional origin, northeast British Columbia: British Columbia Ministry of Energy, Mines and Petroleum Resources Geoscience Reports 2010, p. 35–91.
- Hirji, Zahra, 2014, Frac sand boom—South Dakota is latest state to try to cash in, http://insideclimatenews.org/news/20140626/frac-sand-boom-south-dakota-latest-state-try-cash (accessed 06-26-14).
- Howe, H.J., 1959, Montoya Group stratigraphy (Ordovician) of Trans-Pecos Texas: American Association of Petroleum Geologists Bulletin, v. 43, p. 2285–2332.
- Huq, S.Y., 1983, Potential sand-frac deposits in the basal Deadwood Formation, eastern Black Hills, South Dakota: Rapid City, South Dakota School of Mines and Technology, Master’s degree thesis, 117 p.
- Hurlbut, C.S., Jr., 1971, Dana’s manual of mineralogy, (18th ed.): New York, John Wiley & Sons, Inc., 579 p.
- Jones, R.H., 2009, The middle-upper Ordovician Simpson Group of the Permian Basin—Deposition, diagenesis, and reservoir development, in Ruppel, S.C., ed., Integrated synthesis of the Permian Basin—Data and models for recovering existing and undiscovered oil resources from the largest oil-bearing basin in the U.S.: Texas Bureau of Economic Geology, Final Technical Report, DOE Award DE-FC26-04NT15509, p. 107–147.
- Kansas Geologic Survey, 2014, Correlation of rocks of Simpson age in north-central Kansas with the St. Peter Sandstone and associated rocks in northwestern Missouri, http://www.kgs.ku.edu/Publications/Bulletins/60_1/ (accessed 06-17-14).
- Kelly, J.L., 2006, Silcrete in the St. Peter Sandstone: Madison, University of Wisconsin, Master’s degree thesis, 124 p.
- Kelly, J.L., Fu, Bin, Kita, N.T., and Valley, J.W., 2007, Optically continuous silcrete quartz cements of the St. Peter Sandstone—High precision oxygen isotope analysis by ion microprobe: Geochimica et Cosmochimica Acta, no. 71, p. 3812–3832.
- Kiersch, G.A., and Keller, W.D., 1955, Bleaching clay deposits, Sanders-Defiance Plateau District, Navajo Country, Arizona: Economic Geology, v. 50, p. 469–494.
- Krumbein, W.C., and Sloss, L.L., 1963, Stratigraphy and sedimentation, (2nd ed.): San Francisco, W.H. Freeman and Co., 660 p.
- Kuenen, P.H., 1959, Experimental abrasion: 3, Fluviatile action on sand: American Journal of Science, v. 257, p. 172–190.
- Kuenen, P.H., 1960, Experimental abrasion, 4. Eolian action: Journal of Geology, v. 68, p. 427-449.
- Kuuskraa, Vello, Stevens, Scott, Van Leeuwen, Tyler, and Moodhe, Keith, 2011, World shale gas resources—An initial assessment of 14 regions outside the United States: for U.S. Department of Energy, by Advanced Resources International, Inc., 341 p.
- Kyle, J.R., and McBride, E.F., 2014, Geology of the Voca frac sand district, western Llano uplift, Texas, in Conway, F.M., ed., Proceedings of the 48th Annual Forum on the Geology of Industrial Minerals: Arizona Geological Survey Special Paper 9, p. 1–13.
- Levson, Vic, Pyle, Leanne, and Fournier, Mike, 2012, Identification of potential silica sand deposits in the Northwest Territories: Northwest Territories Geoscience Office, Northwest Territories Open File 2012-6, 76 p.
- Mai, Huazhao, and Dott, R.H., Jr., 1985, A subsurface study of the St. Peter Sandstone in southern and eastern Wisconsin: Wisconsin Geological and Natural History Survey Information Circular 47, 26 p.
- Marshall, T.R., Johnson, D.J., Chadima, S.A., Schulz, L.D., Fahrenbach, M.D., and Herrig, K.G., 2014, Assessment of South Dakota’s sand and alumina resources for use as proppant: South Dakota Geological Survey Oil and Gas Investigation 5, 33 p.
- Martin, J.E., Sawyer, J.F., Fahrenbach, M.D., Tomhave, D.W., and Schulz, L.D., 2004, Geological map of South Dakota: South Dakota Geological Survey Map 10, scale 1:500,000.
- Maslowski, Andy, 2012, Where does frac sand come from?: Well Servicing Magazine, http://www.wellservicingmagazine.com/featured-articles/2012/01/where-does-frac-sand-come-from/, accessed 05-27-14.
- Mazzullo, J.M., and Ehrlich, Robert, 1983, Grain shape variation in the St. Peter Sandstone—A record of eolian and fluvial sedimentation of early Paleozoic cratonic sheet sand: Journal of Sedimentary Research, v. 53, no. 1, p. 105–119.
- McKnight, E.T., 1935, Zinc and lead deposits of northern Arkansas: U.S. Geological Survey Bulletin 853.
- Miller, R.L., and Fuller, J.O., 1947, Geologic and structure contour maps of the Rose Hill oil field, Lee County, Virginia, U.S. Geological Survey Oil and Gas Investigations Map No. OM-76, scale 1:18,000.
- Missouri Department of Natural Resources, 2014, Missouri St. Peter Sandstone, http://www.dnr.mo.gov/geology/geosrv/imac/stpetersandstone.htm (accessed 05-23-14).
- Monteverde, D.H., 1992, Bedrock geologic map of the Sussex County, New Jersey, portions of the Culvers Gap and Lake Maskenozha quadrangles, Map No. 92-1, New Jersey Geological Survey Geologic Map, scale 1:24,000.
- Montgomery, C.T., and Smith, M.B., 2010, Hydraulic fracturing—History of an enduring technology: Society of Petroleum Engineers, JPT Online, http://www.jptonline.org/index.php?id=481, (accessed 06-2012).
- Mudrey, M.G., Jr., LaBerge, P.E., Myers, P.E., and Cordua, W.S., 1987, Bedrock Geology of Wisconsin,
- Northwest Sheet: Wisconsin Geological and Natural History Survey Map 87-11a: 1:250,000.
- O’Driscoll, Mike, 2012, Frac sand frenzy— Focus on supply & demand for hydraulic fracturing sand, Silica Arabia: Jeddah.
- Ohio Division of Geological Survey, 1990 (rev. 2000, 2004), Generalized column of bedrock units in Ohio: Ohio Department of Natural Resources, Division of Geological Survey, 1 p.
- Oil and Gas Journal, 2014, Tight gas sands, http://www.ogj.com/unconventional-resources/tight-gas.html (accessed 03-12-14).
- optek-Danulat, 2014, NTU FTU turbidity units of measure, http://www.optek.com/Turbidity_Measurement_Units.asp, accessed 07-30-14.
- Ostrom, M.E., 1967, Paleozoic stratigraphic nomenclature for Wisconsin: Wisconsin Geological and Natural History Survey Information Circular 8.
- Ostrom, M.E., 1987, St. Lawrence and Jordan Formations (Upper Cambrian) south of Arcadia, Wisconsin, in Biggs, D.L., ed., DNAG Centennial Field Guide, north-central section, v. 3: Boulder, Colorado, Geological Society of America, p. 191–194.
- Pallanich, Jennifer, 2013, Making frac proppants go farther, http://www.fairmountminerals.com/Documents/Santrol/Upstream-Technology-Santrol.aspx (accessed 03-12-14).
- Pettijohn, F.J., Potter, P.E., and Siever, Raymond, 1972, Sand and sandstone: New York, Springer Verlag, 87 p.
- Peterson, Fred, and Pipiringos, G.N., 1979, Stratigraphic relations of the Navajo Sandstone to middle Jurassic formations, southern Utah and northern Arizona: U.S. Geological Survey Professional Paper 1035-B, 43 p.
- Preferred Sands, 2012, Preferred Sands, http://www.preferredsands.com/ (accessed 11-14-13).
- Purdue, A.H., and Miser, H.D., 1916, Eureka Springs-Harrison, Arkansas, folio (no. 202): U.S. Geological Survey Geological Atlas.
- Rapid City Journal, 2014, South Dakota sand not suitable for oil field fracking in North Dakota, http://rapidcityjournal.com/news/local/south-dakota-sand-not-suitable-for-oil-field-fracking-in/article_db1c68bf-7520-5976-a4c0-964579534eb8.html (accessed 07/01/14).
- Repenning, C.A., and Irwin, J.H., 1954, Bidahochi Formation of Arizona and New Mexico: American Association of Petroleum Geologists Bulletin, v. 38, no. 8, p. 1821–1826.
- Rice, C.L., Hiett, J.K., and Koozmin, E.D., 1994, Glossary of Pennsylvanian stratigraphic names, central Appalachian Basin, in Rice, C.L., ed., Elements of Pennsylvanian stratigraphy, central Appalachian Basin: Geological Society of America Special Paper 294, p. 115–155.
- Roberts, J., 2009, Gas fuels proppant prospects: Industrial Minerals, no. 506, p. 37-43.
- Rock Products, 2014a, Frac sand industry briefs, http://www.rockproducts.com/frac-sand/13165-frac-sand-industry-briefs.html (accessed 04-07-14).
- Rock Products, 2014b, Frac sand market to increase 89 percent annually through 2016, http://www.rockproducts.com/frac-sand/analysis/11807-frac-sand-market-to-increase-89-percent-annually-through-2016.html#.U5tLwPldV1Y (accessed 06-13-14).
- Rock Products, 2014c, Well stimulation materials to rise through 2016, http://www.rockproducts.com/frac-sand/analysis/11650- study-well-stimulation-materials-to-rise-through-2016.html#.U5tY8_ldV1Y (accessed 06-13-14).
- Rock Products, 2014d, Meeting demand an issue in frac sand market, http://www.rockproducts.com/frac-sand/analysis/11649-meeting-demand-an-issue-in-frac-sand-market.html#.U5tWy_ldV1Y (accessed 06-13-14).
- Runkel, A.C., 1994, Deposition of the uppermost Cambrian (Croixan) Jordan Sandstone, and the nature of the Cambrian–Ordovician boundary in the Upper Mississippi Valley: Geological Society of America Bulletin v. 106, p. 492–506.
- Runkel, A.C., 2000, Sedimentology of the Upper Cambrian Jordan Sandstone—A classic cratonic sheet sandstone deposited during regression in a “typical” marine setting, Guidebook for 30th annual field conference, Great Lakes section for the Society for Sedimentary Geology, p. 43-46.
- Runkel, A.C. Miller, J.F., McKay, R.M., Palmer, A.R., and Taylor, J.F., 2007, High resolution sequence stratigraphy of lower Paleozoic sheet sandstones in central North America: The role of special conditions of cratonic interiors in development of stratal architecture: Geological Society of America Bulletin, v. 119, p. 860–881.
- Runkel, A.C., and Steenberg, J.R., 2012, Field guidebook on the silica sand resources of western Wisconsin, Precambrian Research Center Guidebook 12-01: Conference on the Silica Sand Resources of Minnesota and Wisconsin, October 1–3, Brooklyn Park, Minnesota, 45 p.
- Rupke, Andrew, 2014, Frack sand in Utah?: Utah Geological Survey Notes, v. 46, no. 1, p. 6–7.
- Ryder, R.T., Harris, A.G., and Repetski, J.E., 1992, Stratigraphic framework of Cambrian and Ordovician rocks in the central Appalachian Basin from Medina County, Ohio, through southwestern and south-central Pennsylvania to Hampshire County, West Virginia: U.S. Geological Survey Bulletin 1839-K, 32 p.
- Saeed, Aram, and Evans, J.E., 2012, Subsurface facies analysis of the Late Cambrian Mt. Simon Sandstone in western Ohio (midcontinent North America): Open Journal of Geology, v. 2, no. 2, p. 35–47. http://dx.doi.org/10.4236/ojg.2012.22004
- Scholle, P.A., 1979, A color illustrated guide to constituents, textures, cements, and porosities of sandstones and associated rocks: American Association of Petroleum Geologists Memoir, no. 28.
- Schweers, R.H., 1949, Connell Sandstone, Oil Creek Formation, Simpson Group, west Texas: American Association of Petroleum Geologists Bulletin, v. 33, p. 2029–2036.
- Shale Reporter, 2013, Unwanted Nebraska sand put to use in oil fields, http://www.shalereporter.com/industry/article_54d2a13c-92b7-11e1-8fe8-001a4bcf6878.html (accessed 11-14-13).
- ShanXi GuangYu Ceramic Proppant Company, 2012, About ceramic proppant, http://www.ceramic-proppants.com/about-ceramic-proppant.html (accessed 06-02-14).
- Short Mountain Silica, 2014, About us, http://www.shortmtnsilica.com/about-us.html (accessed 06-03-14).
- Sil Industrial Minerals, 2014, Frac sand and silica flour, http://www.sil.ab.ca/company (accessed 10-09-14).
- Sloss, L.L., 1963, Sequences in the cratonic interior of North America: Geological Society of America Bulletin, v. 74, p. 93–114.
- Sloss, L.L., 1988, Tectonic evolution of the craton in Phanerozoic time, in Sloss, L.L., ed., Sedimentary cover, North American Craton, The geology of North America, v. D-2: Boulder, Colorado, Geological Society of America, p. 25–52.
- Snyder, Jesse, 2013, Suppliers aim to cope with the logistical challenges of the frack sand market: Alberta Oil Magazine, http://www.albertaoilmagazine.com/2013/10/grains-of-frack-sand (accessed 04-08-14).
- Steele, B.A., 1987, Depositional environments of the White Rim Sandstone Member of the Permian Cutler Formation, Canyonlands National Park, Utah: U.S. Geological Survey Bulletin 1592, 20 p.
- Steinbock, Lee, 2014, Proppant usage will continue to rise: The Freedonia Group, Inc., http://upstreampumping.com/article/upstream-market/jun-2014/proppant-usage-will-continue-rise , 07-28-14.
- Stikine Gold, 2014, Frac sand mining and processing for northeastern British Columbia shale gas, http://www.stikinegold.com/i/pdf/CorporatePresentation.pdf (accessed 01-29-14).
- Suter, Max, Bergstrom, R.E., Smith, H.F., Emrich, G.H., Walton, W.C., and Larson, T.E., 1959, Preliminary report on ground-water resources of the Chicago region, Illinois: Illinois State Water Survey and State Geological Survey Cooperative Report 1, 89 p.
- Suhm, R.W., and Ethington, R.L., 1975, Stratigraphy and conodonts of Simpson Group (Middle Ordovician), Beach and Baylor Mountains, west Texas: American Association of Petroleum Geologists Bulletin, v. 59, p. 1126-1135.
- Sweet, P.C., 1986, Virginia’s industrial silica resources: Virginia Minerals, v. 32, no. 1, p. 1–9.
- Syverson, K.M., and Colgan, P.M., 2004, The Quaternary of Wisconsin—A review of stratigraphy and glaciation history, in Ehlers, J., and Gibbard, P.L., eds., Quaternary glaciations—Extent and chronology, Part II, North America, Developments in Quaternary science, 2: Amsterdam, The Netherlands, Elsevier B.V., p. 295–310.
- Syverson, K.M., Clayton, Lee, Attig, J.W., and Mickelson, D.M., eds., 2011, Lexicon of Pleistocene stratigraphic units of Wisconsin: Wisconsin Geological and Natural History Survey Technical Report 1, 180 p.
- Texas Frac Sands, 2014, Brady, Texas, area frac sand—Product specifications, http://texasfracsands.com/id1.html (accessed 03-13-14).
- The Wall Street Journal, 2014, Rainmaker Mining Corp. announces acquisition of Peace River frac sand property, Alberta, http://online.wsj.com/article/PR-CO-20140205-908391.html (04-08-14).
- Thomas, D.A., 1992, Lithostratigraphy, petrology, diagenesis, and environments of deposition of the Upper Cambrian Jordan Sandstone (M.S. thesis): Duluth, Minnesota, University of Minnesota, 206 p.
- U.S. Energy Information Administration, 2011, North American shale plays, as of May 2011 http://www.eia.gov/oil_gas/rpd/northamer_gas.pdf (accessed 02-10-14).
- U.S. Silica, 2014a, Berkeley Springs, West Virginia, http://www.ussilica.com/locations/berkeley-springs-wv (accessed 06-04-14).
- U.S. Silica, 2014b, Mill Creek, Oklahoma, http://www.ussilica.com/locations/mill-creek-ok (accessed 06-04-14).
- U.S. Silica, 2014c, Rockwood, Michigan, http://www.ussilica.com/locations/rockwood-mi (accessed 06-04-14).
- Virta, R.L., 2014, Clay and shale: U.S. Geological Survey Minerals Yearbook 2012, p. 18.11-18.23.
- Visocky, A.P., Sherrill, M.G., and Cartwright, Keros, 1985, Geology, hydrology, and water quality of the Cambrian and Ordovician systems in northern Illinois: Illinois State Geological Survey and Illinois State Water Survey Cooperative Groundwater Report 10, 136 p.
- Walcott, C.D., 1896, The Cambrian rocks of Pennsylvania: U.S. Geological Survey Bulletin 134, 43 p.
- Wilmarth, M.G., 1938, Geologic Names Committee remarks in Wilmarth, M.G., Lexicon of geologic names of the United States (including Alaska), U.S. Geological Survey Bulletin, no. 896, prts. 1-2, p. 1-2396.
- Winfree, K.E., 1983, Depositional environments of the St. Peter Sandstone of the upper Midwest: Madison, University of Wisconsin, Master’s degree thesis, 114 p.
- Wolfe, M.E., 2013, Fracture sand in Ohio: Ohio Department of Natural Resources, Division of Geological Survey GeoFacts 27, 2 p.
- Wright, W.F., 1965, Petroleum geology of the Simpson Group, west Texas and southeast New Mexico: Tulsa Geological Society Digest, v. 33, p. 62-73.
- Young, H.L., 1992, Hydrogeology of the Cambrian-Ordovician aquifer system in the northern Midwest, United States, with a section on ground-water quality by D.I. Siegel: U.S. Geological Survey Professional Paper 1405-B, 99 p.
- Zdunczyk, Mark, 2007, The facts of frac: Industrial Minerals Journal, no. 1, p. 58–61.
- Zdunczyk, Mark, 2014, Hydraulic fracturing sand (frac sand): Mining Engineering, v. 66, no. 7, p. 53–55.
- Zdunczyk, M.J., 1992, Short Mountain Silica—A new producer in Tennessee: Mining Engineering, v. 7.0, p. 3.